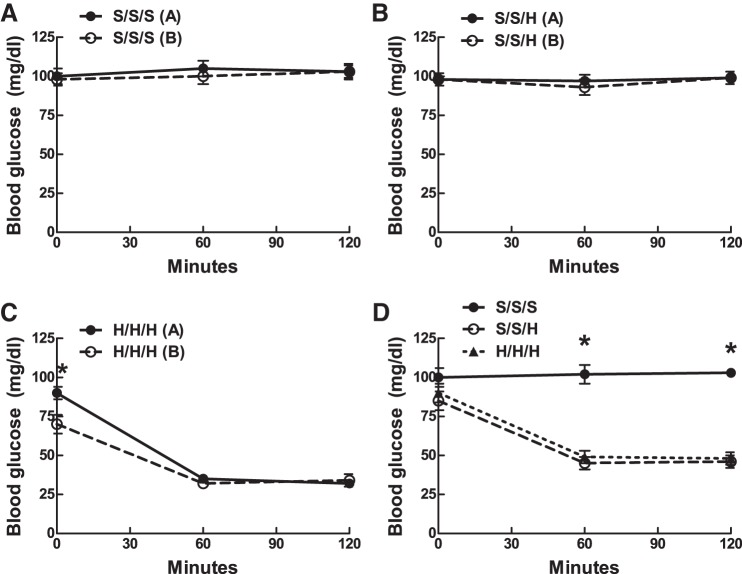
Fig. 2.
Day 1 and 2 blood glucose values during IIH. A: day 1 blood glucose values in animals exposed to 3 saline injections in a 2-day protocol (S/S/S). B: day 1 blood glucose values in animals exposed to 2 saline injections on day 1 followed by IIH on day 2 (S/S/H). C: day 1 blood glucose values in animals exposed to 3 insulin injections in a 2-day protocol (H/H/H). D: day 2 blood glucose values in animals exposed to 3 saline injections (S/S/S), 2 saline injections followed by a single bout of IIH (S/S/H), or 3 bouts of IIH (H/H/H) in a 2-day protocol. C: *P < 0.05, day 1 vs. day 2. D: *P < 0.05 S/S/S vs. S/S/H and S/S/S vs. H/H/H. Error bars indicate ± SE throughout.

