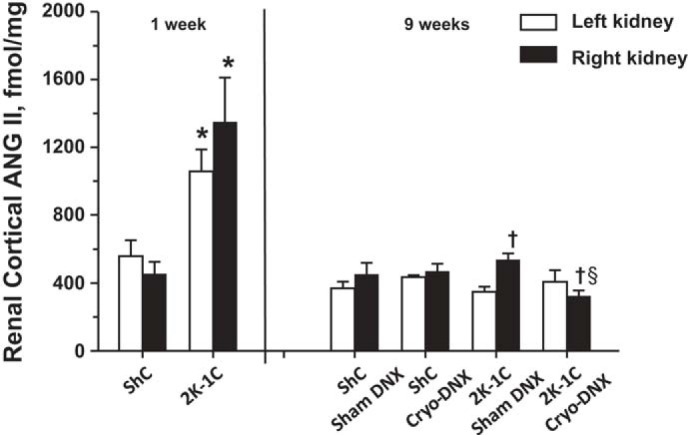
Fig. 6.

Renal cortical tissue ANG II values in kidneys from ShC and 2K-1C rats 1 wk after clipping (2K-1C) or sham clipping (ShC) and 9 wk after clipping or sham clipping the right renal artery. Tissues at week 9 were obtained from rats with data depicted in Figs. 2–4. Values are means ± SE; for week 1, ShC (n = 6) and 2K-1C (n = 6); for week 9, ShC sham DNX (n = 11), ShC Cryo-DNX (n = 9), 2K-1C sham DNX (n = 9), and 2K-1C Cryo-DNX (n = 11). *P < 0.05 vs. ShC, left kidney in 2K-1C compared with left kidney in ShC and right kidney in 2K-1C compared with right kidney in ShC; †P < 0.05 vs. left kidney, same treatment; §P < 0.05 vs. right kidney, 2K-1C sham DNX.
