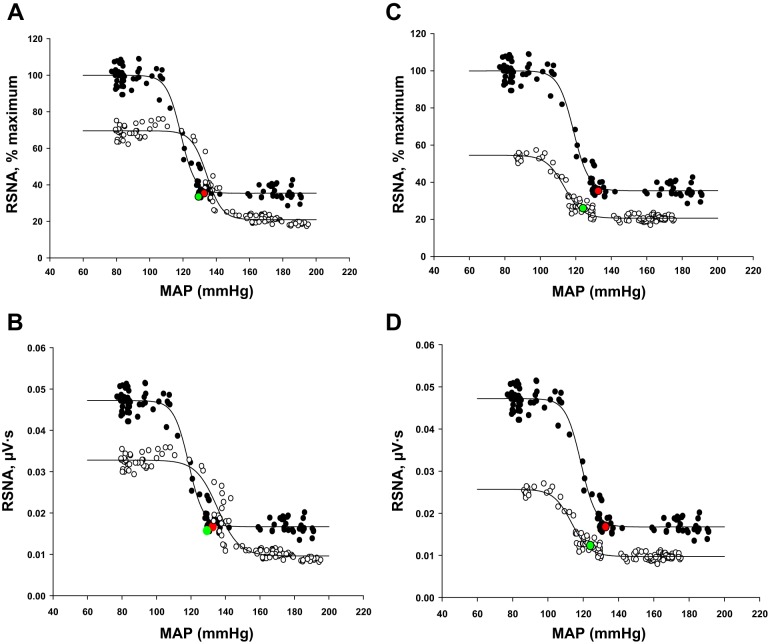
Fig. 9.
Baroreflex curves of RSNA in a single 2K-1C rat before (baseline; ●) and on days 3 (A and B) and 9 (C and D) after cryotreatment (cryo-DNX; ○) of the nerve to the clipped kidney. Values are plotted as %maximum RSNA (A and C) and as raw nerve activity (μV/s; B and D). Resting values are shown in red for pretreatment and green for posttreatment.

