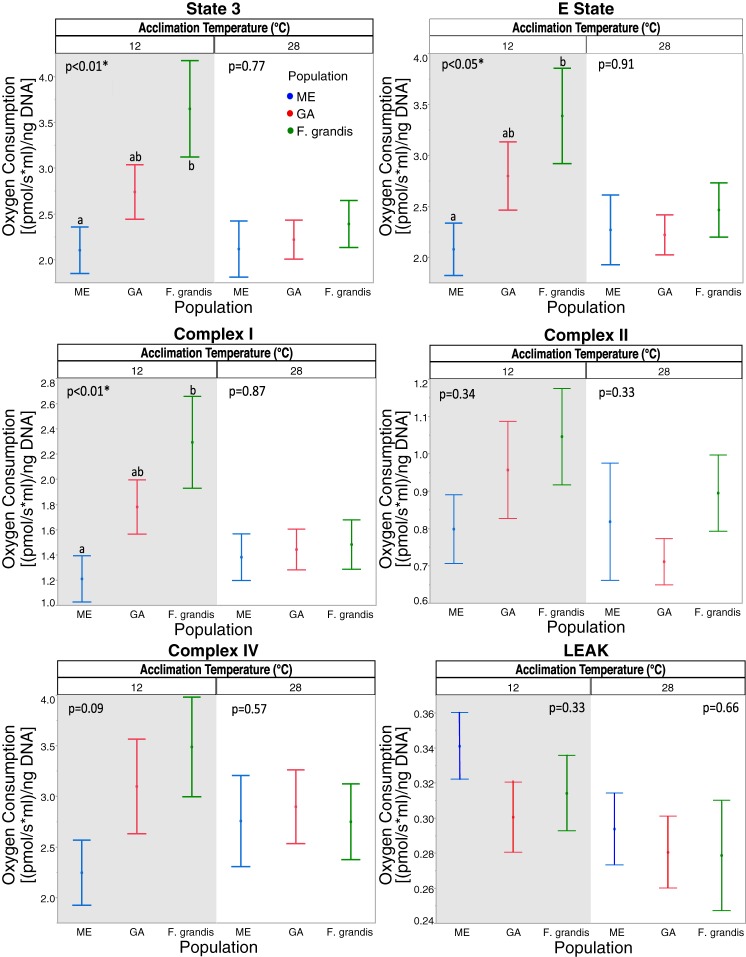
Fig. 6.
Difference in OxPhos between populations at different acclimation temperatures: 12°C (shaded background) and 28°C (white background). Green lines, F. grandis; red and blue lines, GA and ME F. heteroclitus populations, respectively. Values are means ± SE. *Significant effect of population at each acclimation temperature (P < 0.05).

