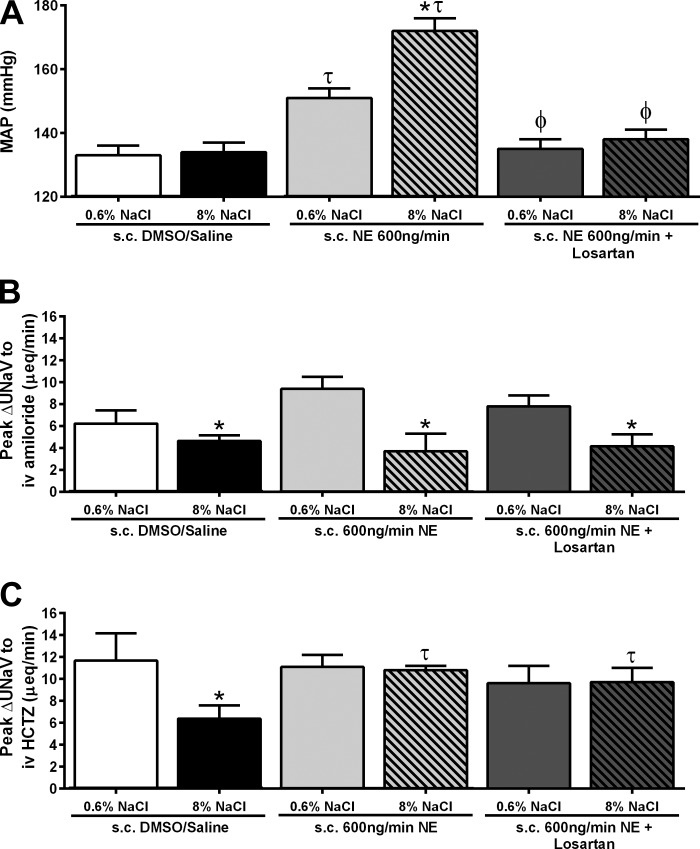
Fig. 6.
Basal MAP (mmHg) (A), peak natriuresis (UNaV; μeq/min) in response to an intravenous amiloride infusion (2 mg/kg) (B), and peak natriuresis (UNaV; μeq/min) in response to an intravenous infusion of amiloride (2 mg/kg) in combination with HCTZ (2 mg/kg) (C), in conscious male Sprague-Dawley rats receiving either a subcutaneous 50:50 DMSO/isotonic saline vehicle infusion, a subcutaneous NE (600 ng/min) infusion, or a subcutaneous NE (600 ng/min) and losartan (3 mg·kg−1·day−1) infusion maintained on either a normal (0.6% NaCl) or high-salt (8% NaCl) diet for 14 days. Data are expressed as means ± SE (n = 6/group). *P < 0.05 vs. respective 0.6% NaCl group value; τP < 0.05 vs. respective DMSO/saline group value; ϕP < 0.05 vs. respective NE group value. Data for subcutaneous DMSO/saline and subcutaneous NE infusion reproduced from Figs. 4 and 5 for clarity.

