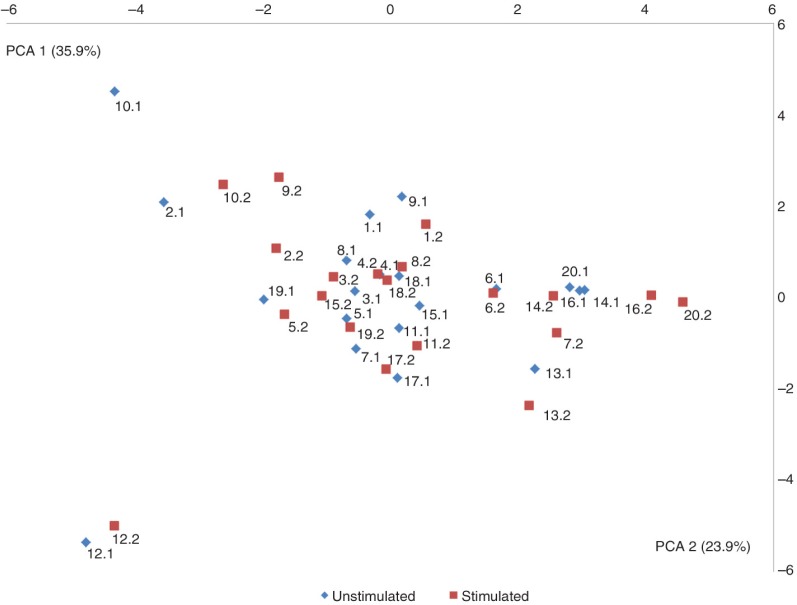
Fig. 3.
Principal component analysis visualized two-dimensionally with axes expressed as the two most crucial components accounting for 59.8% of the variation of the dataset. Sample denotation: 1–20 (Individual 1–Individual 20). Unstimulated saliva samples (blue) and stimulated saliva samples (red).

