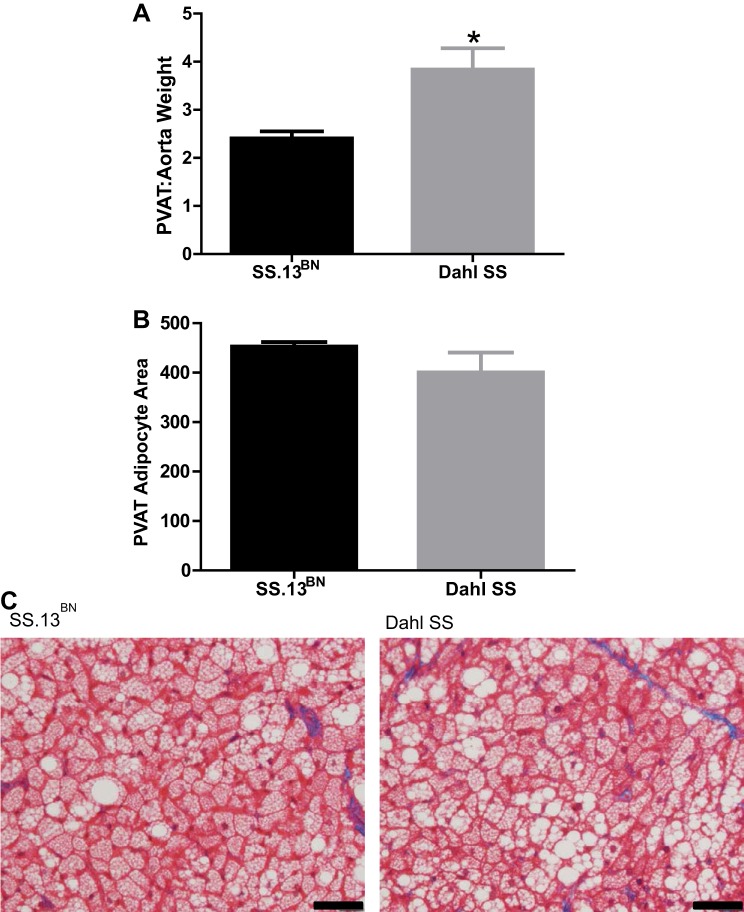
Fig. 5.
A: perivascular adipose tissue (PVAT) weight normalized to aorta weight (PVAT:aorta weight) in SS.13BN rats (n = 9) and Dahl SS rats (n = 5). B: quantification of PVAT adipocyte area. C: representative histological images of PVAT adipocytes in SS.13BN rats and Dahl SS rats. *P < 0.05 vs. SS.13BN rats.

