
Fig. 6.
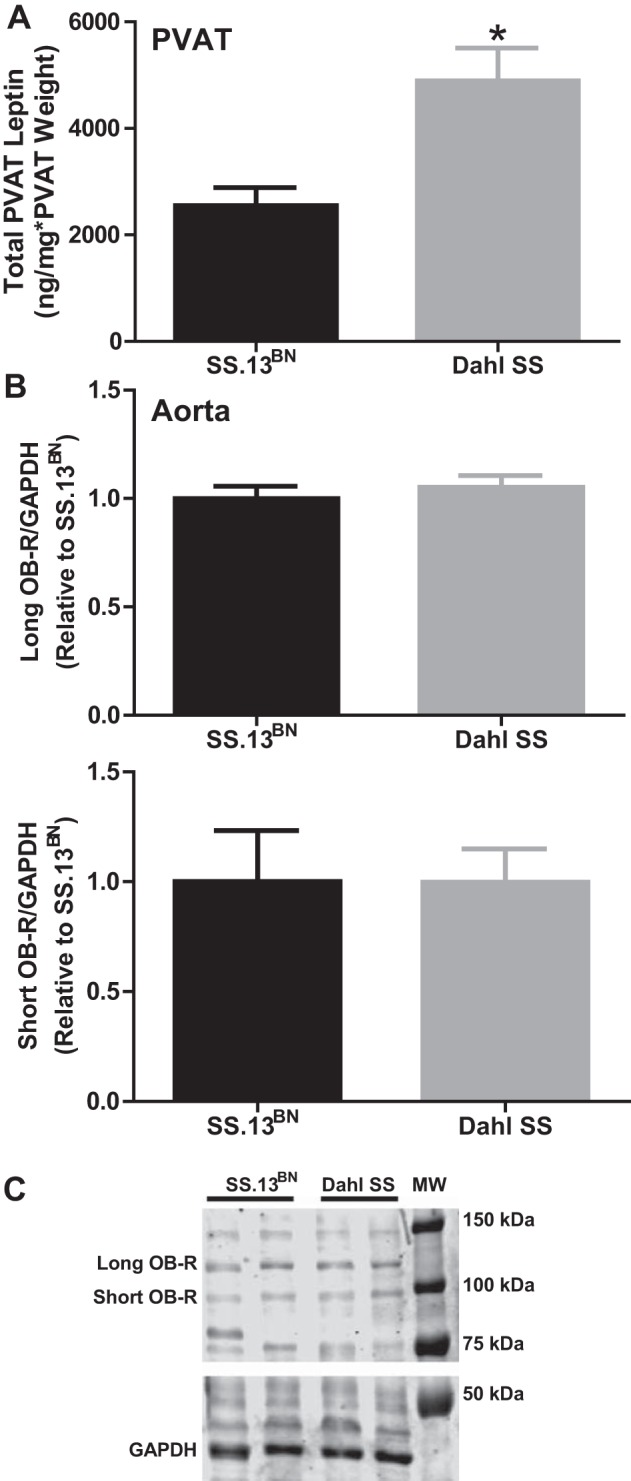
A: total leptin peptide levels in the PVAT from SS.13BN rats and Dahl SS rats. These levels were calculated by normalizing leptin levels to milligrams of total PVAT protein and then multiplied by relative PVAT:aorta weight. B: semiquantification of results from Western blot analyses examining expression of the long Ob-R (top) and short Ob-R (bottom) forms of the leptin receptor in aortic vascular tissue. C: representative Western blot. n = 6 rats/group. *P < 0.05 vs. SS.13BN rats.