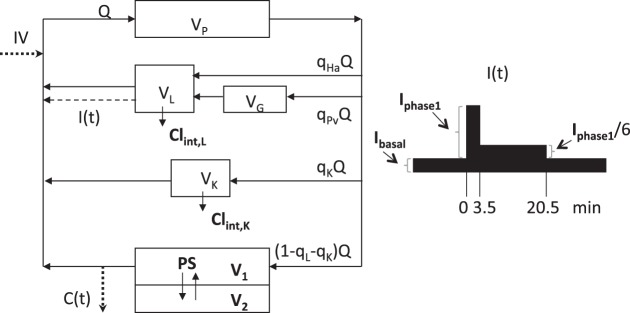
Fig. 1.
Schematic structure of the circulatory model of insulin dynamics, with exogenous input [glucose, 0.3 g/kg as a bolus dose at time 0 and insulin infusion (0.3 U/kg in 1 min) at 20 min] and endogenous posthepatic delivery rate of insulin, I(t). C(t) denotes the sampled insulin concentration. Subsystems include the pulmonary and splanchnic circulation kidneys, and the rest of the systemic circulation (mainly skeletal muscle). Model parameters are described in Table 1. (Bold letters denote those parameters estimated in the population analysis.) The posthepatic delivery rate of insulin, I(t), is shown in the inset on the right. It consists of the basal delivery rate, Ibasal, plus the assumed pattern of glucose-induced delivery consisting of a peak rate, Iphase1, followed by a reduced rate, Iphase1/6.

