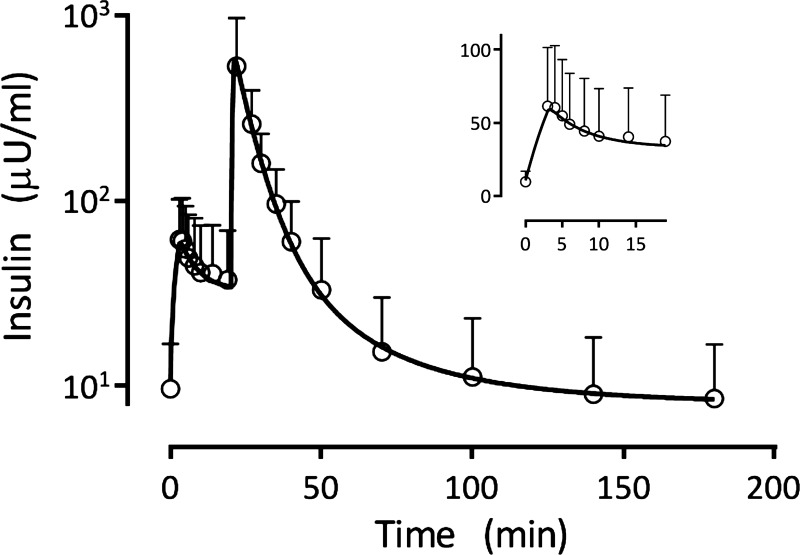
Fig. 3.
Average of the 154 individual subject model predicted insulin concentration time curves, together with the measured plasma insulin values (means ± SD). The inset shows the same information from the time of glucose administration prior to insulin administration, with the ordinate shown on a linear scale.

