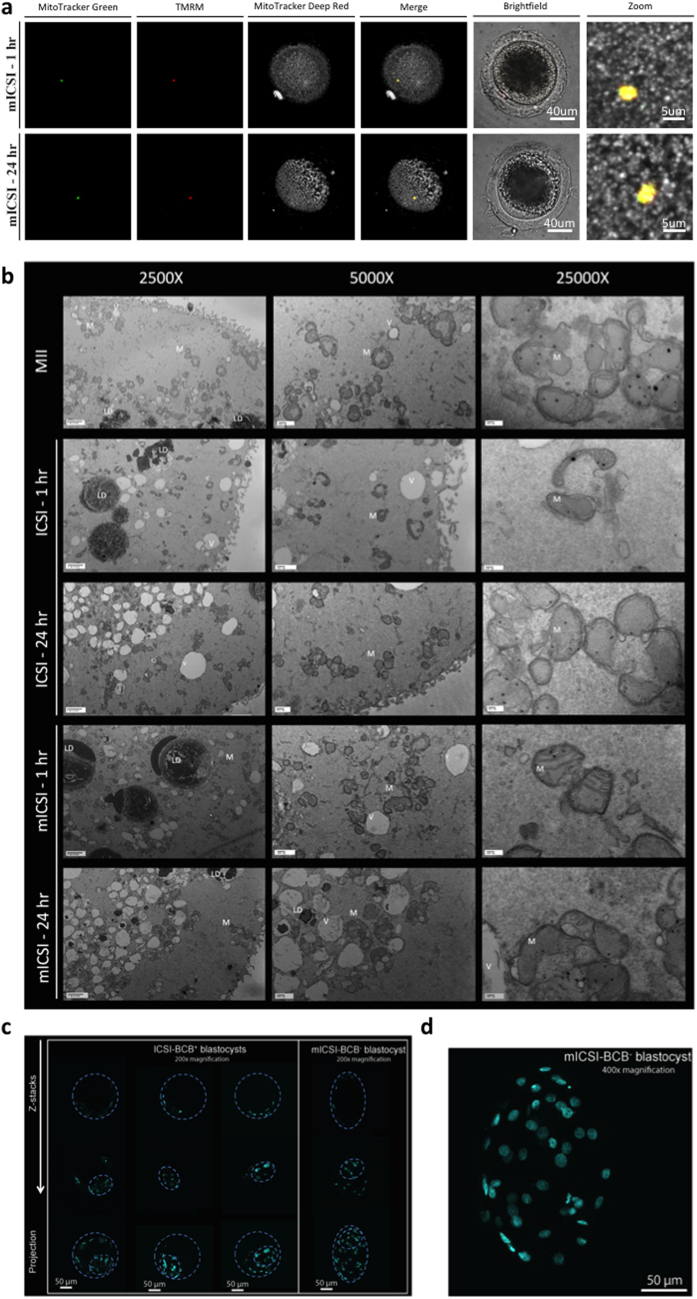
Figure 2. Generation of mICSI-derived blastocysts.
(a) Localization of mitochondria following injection into BCB− MII oocytes at 1 hr and 24 hr post insemination. Mitochondria endogenous to the oocyte are labeled with MitoTracker Deep Red (grey). The injected mitochondria are labeled with TMRM (red) and MitoTracker Green (green). The confocal z-stacks are displayed as maximum intensity projections (X40 magnification). (b) Transmission Electron Microscopy of MII oocytes, ICSI-1 hr, ICSI-24 hr, mICSI-1 hr, and mICSI-24 hr at 2500X, 5000X and 25,000X magnification. Abreviations include; LD = lipid droplet, V = vacuole, M = mitochondria. (c) DAPI staining of ICSI BCB+ and mICSI BCB− blastocysts highlighting the presence of an inner cell mass. (d) Enlargement of a mICSI BCB− blastocyst.

