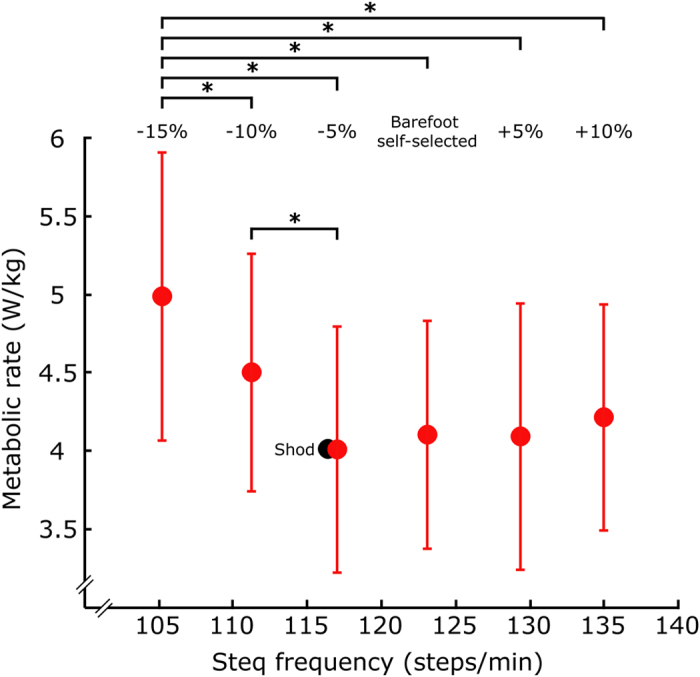
Figure 4. Average metabolic rate for subjects walking barefoot at step frequencies from −15% to +10% relative to their barefoot SS step frequency.

The metabolic rate for shod walking at the shod SS frequency is depicted in black. Subject averaged metabolic data resulted in a shallow bowl. Inter-subject means and standard deviations are depicted. Repeated measures analysis of variance (ANOVA) was used for statistical comparisons. Significant differences are denoted with asterisks (*).
