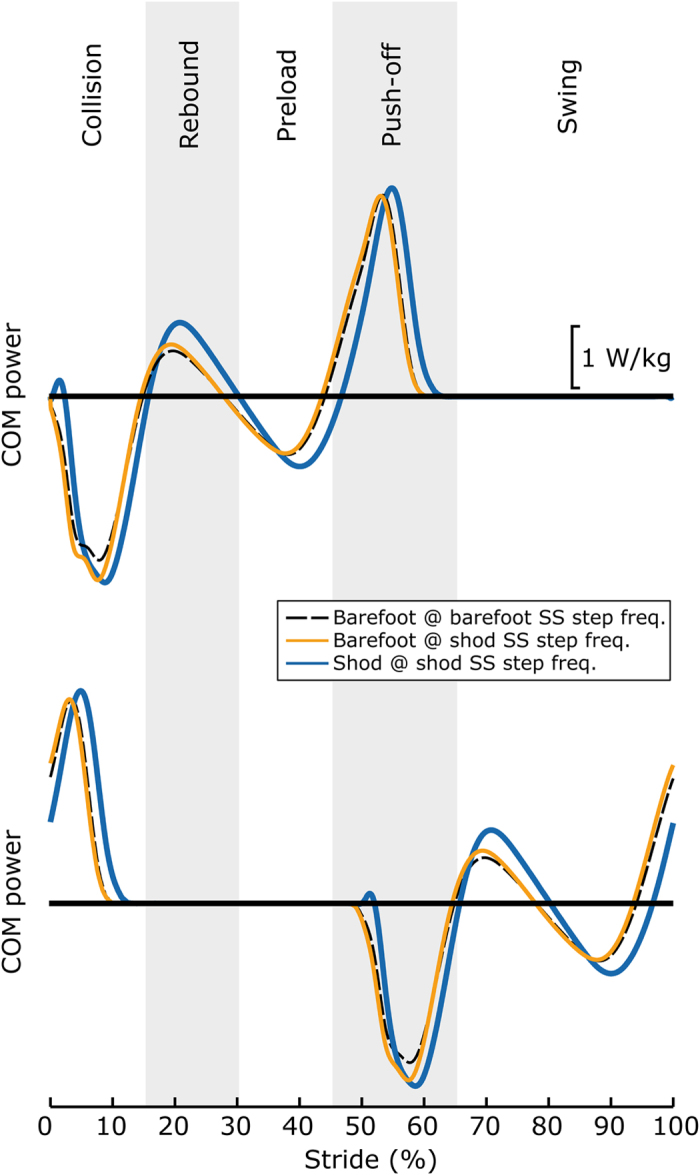
Figure 5. Average center-of-mass (COM) power.

Leading (top) and trailing (bottom) limb power curves are depicted separately. Barefoot walking resulted in similar COM power waveforms at both barefoot and shod SS step frequencies when normalized to stride cycle. Shod walking exhibited more substantial differences in COM power, in terms of the magnitude and timing of peaks. The stride cycle is depicted from foot contact to ipsilateral foot contact. Collision, Rebound, Preload, Pushoff and Swing phases of gait are labeled, based on fluctuating regions of positive and negative COM power.
