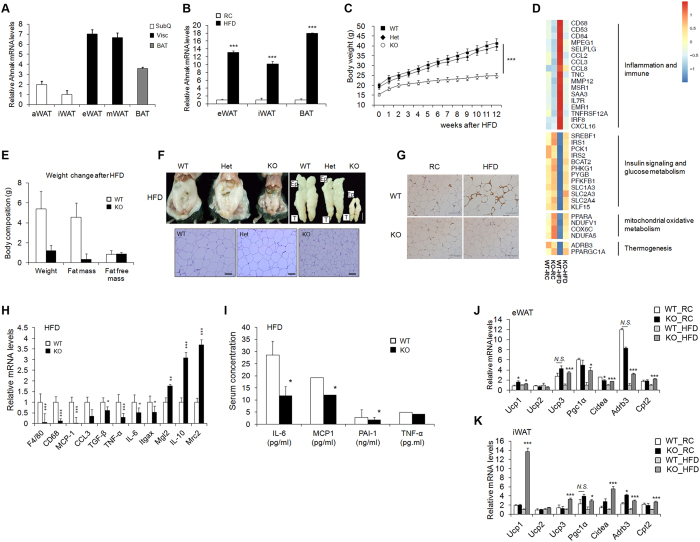
Figure 1. Effect of AHNAK ablation on fat tissue.
(A) AHNAK mRNA expression determined by qPCR analysis of multiple adipose tissues from 10- to 12-week-old male wild-type mice (n = 4) and expression was normalized to that of 36B4. (B) AHNAK mRNA levels in eWAT, iWAT, and BAT from wild-type mice fed RC or HFD (n = 5–7 per group). (C) Body weight of male WT, heterozygotic (Het), and homozygotic knockout (KO) mice (n = 4–5 per group). (D) Representative gene expression profiles displaying differentially expressed genes in eWAT from RC-or HFD-fed WT and KO mice (full dataset available online as NCBI GEO data set GSE37218). (E) Changes in body composition of WT and KO mice fed HFD analysed by MRS (n = 7–9). (F) Representative images of epididymal fat depots and H&E staining of tissues from WT, hetero, and KO mice fed HFD. (G) Representative images of immunostaining of eWAT with an antibody against Mac-2. (H) mRNA expression of inflammation-related genes in mice fed HFD (n = 6–9). (I) Serum biochemistry of inflammation profiles in overnight-fasted mice fed HFD (n = 5–9). (J,K) mRNA expression of thermogenic genes in eWAT (J) and iWAT (K) from RC or HFD-fed WT and KO mice (n = 5). The data are presented as the mean ± SEM. *P < 0.05, **P < 0.01, ***P < 0.001, wild-type (WT) versus Ahnak−/− (KO) mice.

