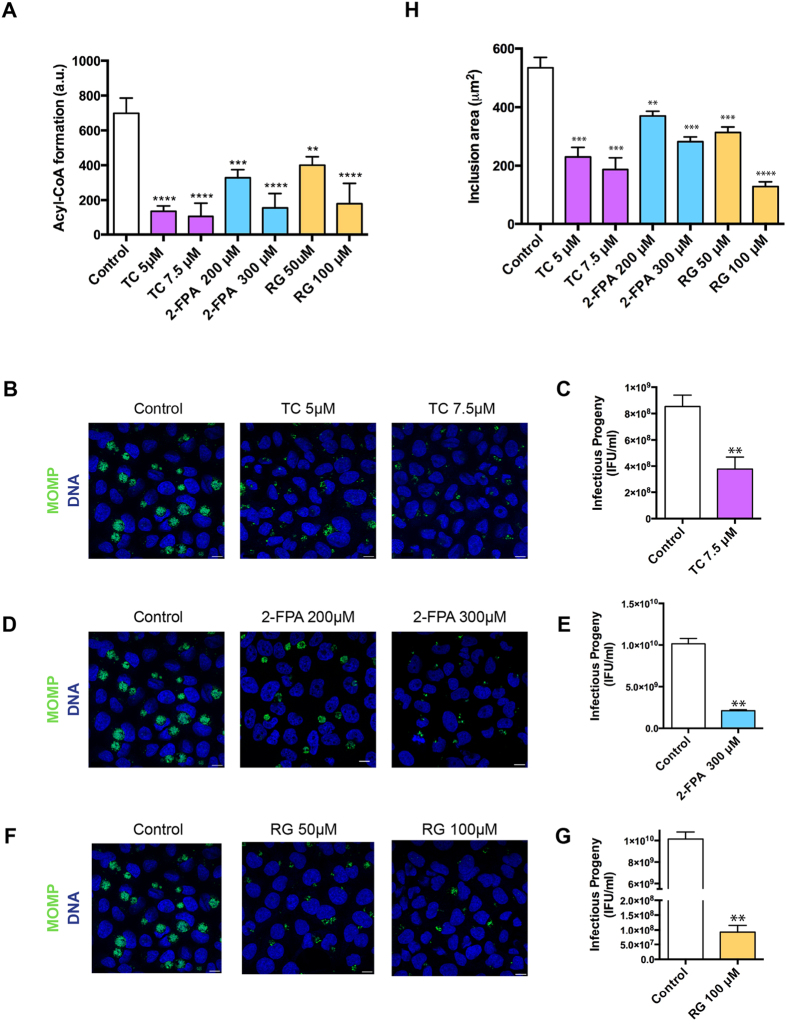
Figure 2. ACSL activity is required for C. trachomatis (Ct) growth and development.
(A) HeLa cells were treated for 16 h with the following ACSL activity inhibitors: 5 μM and 7.5 μM Triacsin C (TC); 200 μM and 300 μM 2-Fluoropalmitic acid (2-FPA), and 50 μM and 100 μM Rosiglitazone (RG). The cells were lysed, and ACSL activity was measured as fluorescent acyl-CoA recovered. Error bars indicate standard deviation for three independent experiments. The asterisks indicate statistically significant differences at ∗∗p < 0.01, ∗∗∗p < 0.001, ∗∗∗∗p < 0.0001 by the two-tailed t-test; (B) HeLa cells were treated with the inhibitor TC at the indicated concentrations for 16 h and then infected with Ct L2, without removing the inhibitor from the media. At 24 hpi, the cells were fixed and prepared for confocal microscopy. Labeling was done with anti-Ct MOMP antibody (green) and with Hoechst to stain for nuclear and bacterial DNA (blue). Scale bar, 10 μm; (C) HeLa cells were treated with 7.5 μM TC for 16 h and infected with Ct L2 for 24 h, without removing the inhibitor from the media. The cultures were used for reinfecting new HeLa cell monolayers and analyzed for infectivity and production of progeny. Values (mean ± standard error for three independent experiments) are shown as inclusion forming units (IFU)/mL. Asterisks denote statistically significant differences at ∗∗p < 0.01, by the two-tailed t-test. The same experiment was carried out with the inhibitor 2-FPA (D,E) and RG (F,G) at noted concentrations; (H) HeLa cells treated with the inhibitors and infected with Ct as described previously were stained with anti-Ct MOMP antibody and imaged using confocal microscopy. The images were analyzed using Imaris X64 software to identify Regions Of Interest (ROI) coinciding with the inclusions. The software was used to calculate the mean inclusion area (in μm2) based on the ROIs. Values (mean ± standard error for three independent experiments) are shown. The asterisks indicate statistically significant differences between each condition compared to the control by the two-tailed t-test (∗∗p < 0.01, ∗∗∗p < 0.001, ∗∗∗∗p < 0.0001).

