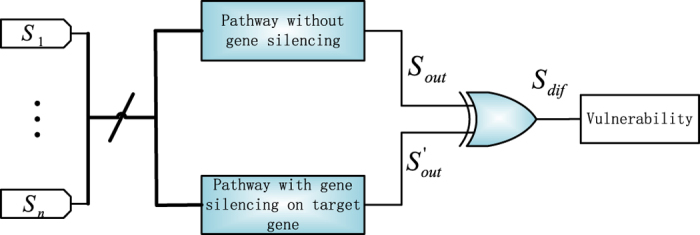
Figure 5. Stochastic model to compute the vulnerability of a target gene.

Si denotes the stochastic sequence of an input node, i ∈ {1, 2,  , n}, where n is the total number of input genes in the investigated pathway.
  and
and  indicate the output sequences for the pathway without and with gene silencing, respectively.
