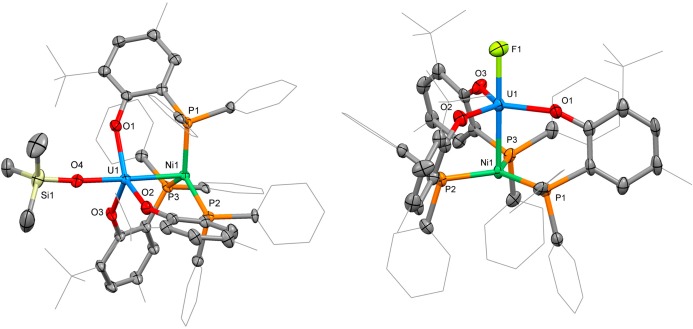
Figure 6.
Thermal ellipsoid plots for 4 and 5. Solvent molecules and hydrogen atoms are omitted, and selected carbon atoms are depicted as a wireframe, for clarity. Thermal ellipsoids drawn at 50% probability. Selected bond distances (Å) and angles (deg) for 4: U1–Ni1, 2.556(1); U1–O1, 2.210(6); U1–O2, 2.188(6); U1–O3, 2.160(6); U1–O4, 2.093(6); Ni1–P1, 2.208(2); Ni1–P2, 2.213(3); Ni1–P3, 2.221(2); O4–U1–Ni1, 178.6(2); U1–Ni1–P1, 87.85(7); U1–Ni1–P2, 97.84(7); U1–Ni1–P3, 94.95(7); O1–U1–Ni1–P1, 37.4(2); O2–U1–Ni1–P2, 18.4(2); O3–U1–Ni1–P3, 28.1(2). For 5: U1–Ni1, 2.520(1); U1–F1, 2.091(5); U1–O1, 2.159(8); U1–O2, 2.174(6); U1–O3, 2.199(5); Ni1–P1, 2.225(3); Ni1–P2, 2.215(3); Ni1–P3, 2.212(2); F1–U1–Ni1, 178.8(2); U1–Ni1–P1, 96.16(7); U1–Ni1–P2, 91.56(7); U1–Ni1–P3, 91.82(7); O1–U1–Ni1–P1, 22.2(2); O2–U1–Ni1–P2, 30.1(2); O3–U1–Ni1–P3, 29.1(2).

