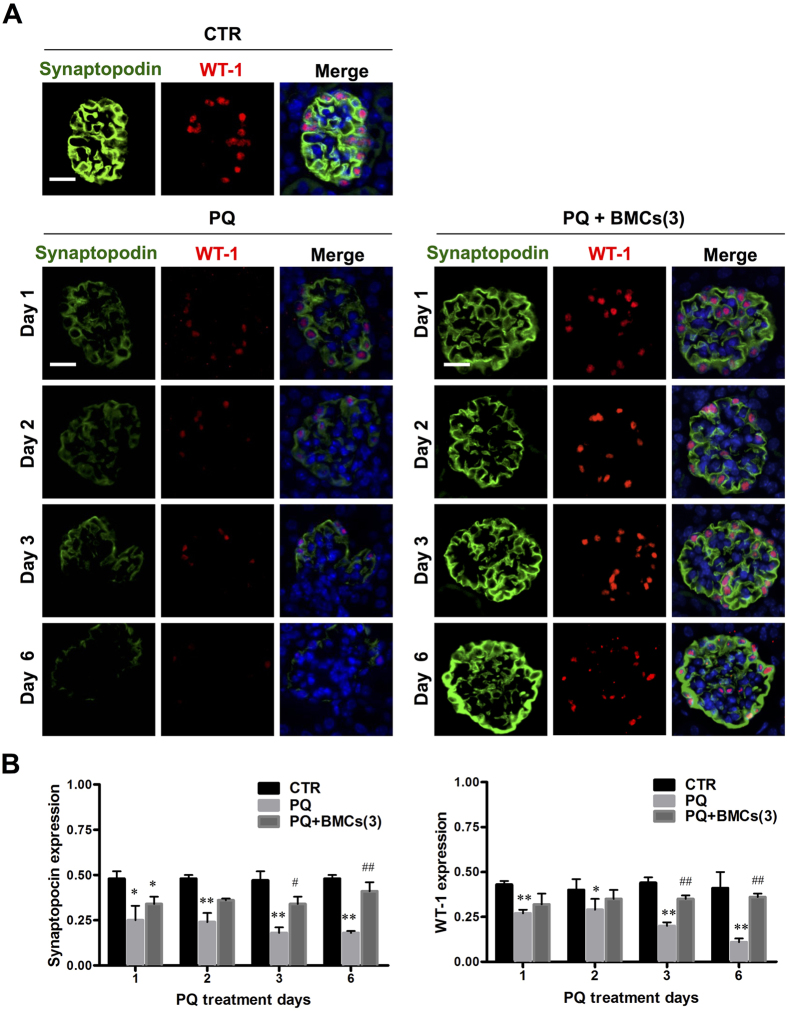
Figure 3. Podocytes depletion of C57BL/6 mice in the treatment groups.
(A) Kidney tissue from mice in the control, PQ-only and PQ + BMCs (3) groups were collected on days 1, 2, 3 and 6. Kidney sections underwent double immunofluorescence staining to validate synaptopodin and WT-1 expression in the glomerulus. Synaptopodin is labeled in green (Alex488nm fluorescence) and distributed within the cytoplasm of podocytes. WT-1, a podocytes nuclear marker, is shown in red (Cy3 fluorescence). DAPI was used to stain the nucleus. These images are representative of each group. The control group displayed standard synaptopodin and WT-1 distribution. Following PQ-only treatment, synaptopodin and WT-1 expression dramatically diminished, whereas triple BMCs co-treatment resulted in markedly recovered synaptopodin and WT-1 expression. Scale bar is 50 μm, n = 6. (B) Quantification of glomerular synaptopodin and WT-1 expression in kidneys of the control, PQ-only and PQ + BMCs (3) groups. *p < 0.05, **p < 0.01 vs. control group. #p < 0.05, ##p < 0.01 vs. PQ-only group.

