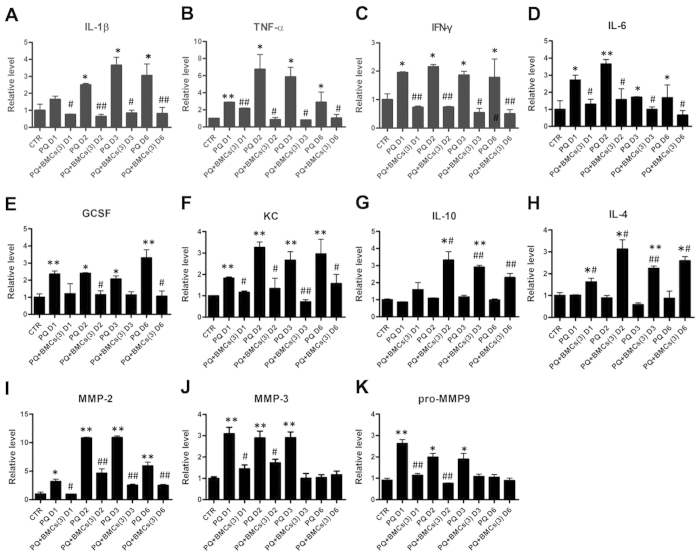
Figure 6. Kidney inflammatory cytokine and chemokine levels in C57BL/6 mice from the different treatment groups.
Kidney supernatants from the control, PQ-only and PQ + BMCs (3) groups were collected on days 1, 2, 3 and 6. The expression levels of (A), IL-1β; (B), TNF-α; (C), IFN-γ; (D), IL-6; (E), GCSF; (F), KC; (G), IL-10; (H), IL-4; (I), MMP2; (J), MMP3; (K), pro-MMP9 were shown relative to the control group. *p < 0.05, **p < 0.01 vs. control group. #p < 0.05, ##p < 0.01 vs. PQ-only group.

