
Figure 2.
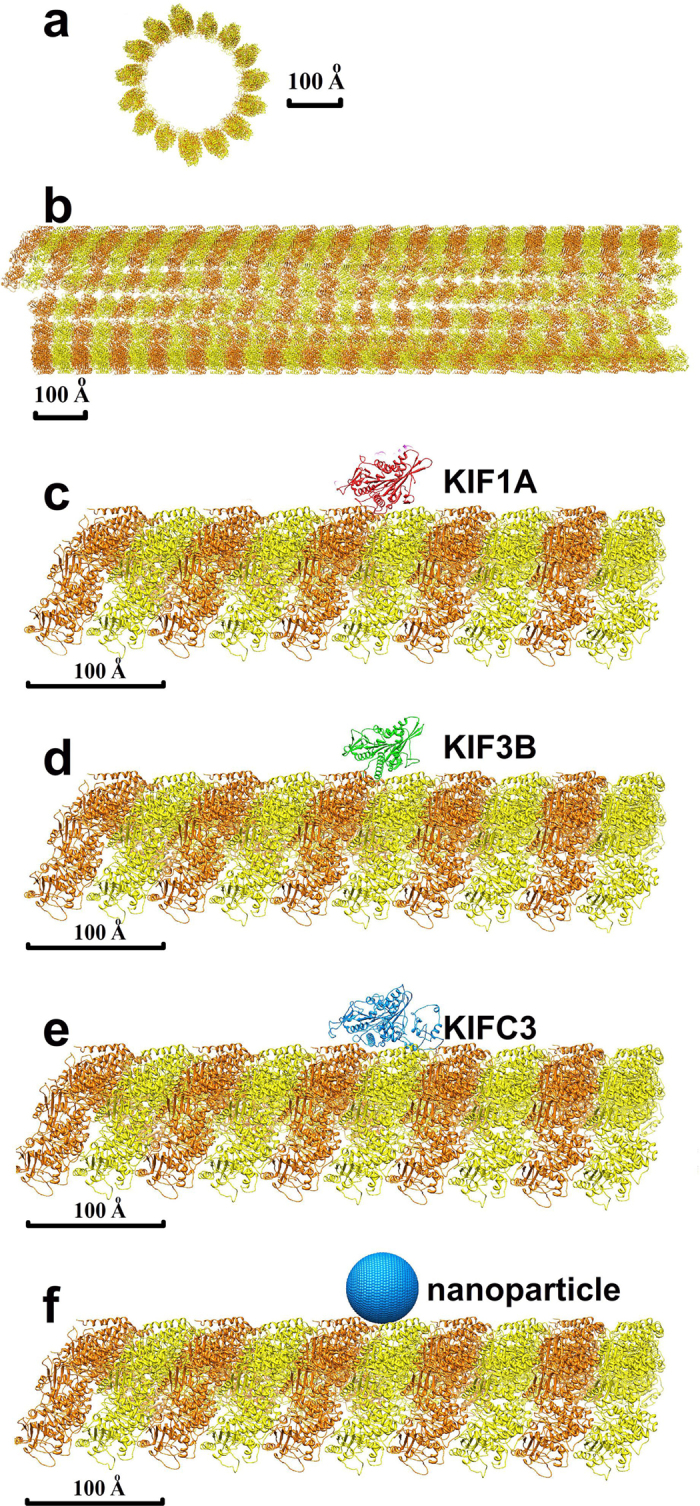
(a) The end view of the modeled microtubule. (b) The side view of the modeled microtubule. α-tubulin is orange and β-tubulin is yellow in both panels. The model was constructed using symmetry information from PDBID 3J2U, and rotation and translation manipulations were applied to the tubulins to model a 16-dimer length microtubule segment. (c–f) Details of the computational system. Each panel shows details of the specific ligand associated to the microtubule in which α-tubulin is orange and β-tubulin is yellow. (c) KIF1A, a kinesin-3, motor domain associated to a microtubule in its initial location of the simulation. (d) KIFC3, a kinesin-14, motor domain associated to a microtubule in initial location of the simulation. (e) Cin8, a bidirectional kinesin in its initial location of the simulation. (f) A uniformly charged nanoparticle associated to a microtubule in its initial location of the simulation.