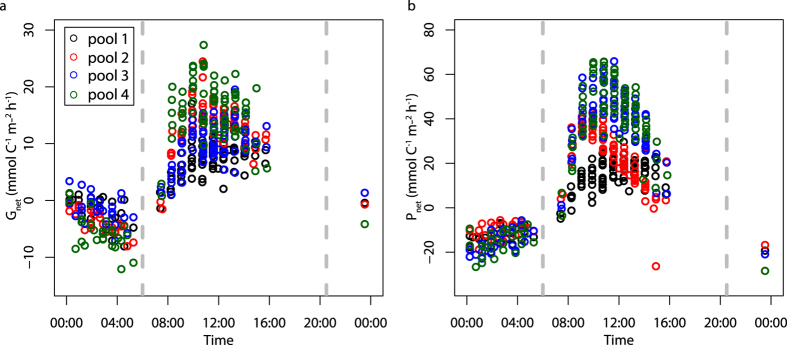
Figure 3. Temporal cycles in community calcification (Gnet) and production (Pnet).
(a) Gnet (mmol C−1 m−2 h−1) and (b) Pnet (mmol C−1 m−2 h−1) against time of day in each of the tide pools. Dashed grey lines show the approximate times of sunrise and sunset. Daytime data were collected in 2014 and nighttime data in 2015.

