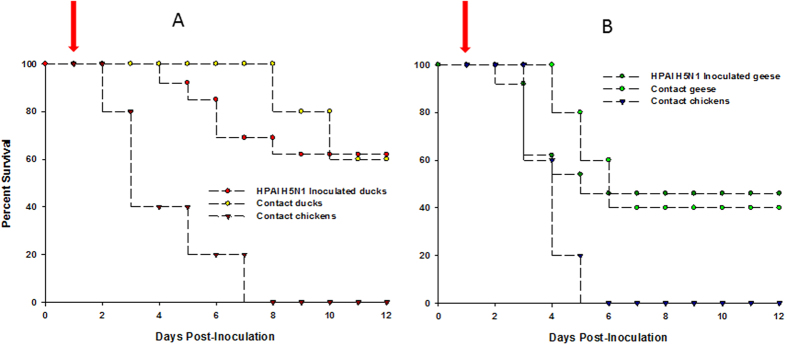
Figure 4. Survival curves of birds infected with 10,000 PFU of FAV-002/H5N1 and their contacts.
(A) shows the survival curves of Muscovy ducks that were infected with 10,000 PFU of FAV-002/H5N1. The arrow indicates when Muscovy ducks and chickens that were placed among the infected ducks at 24 hrs post-infection. (B) shows the survival curves of Chinese geese that were infected with 10,000 PFU of FAV-002/H5N1 and contact Chinese geese and chickens that were placed in the same animal cubicle at 24 hrs post-infection (arrow).

