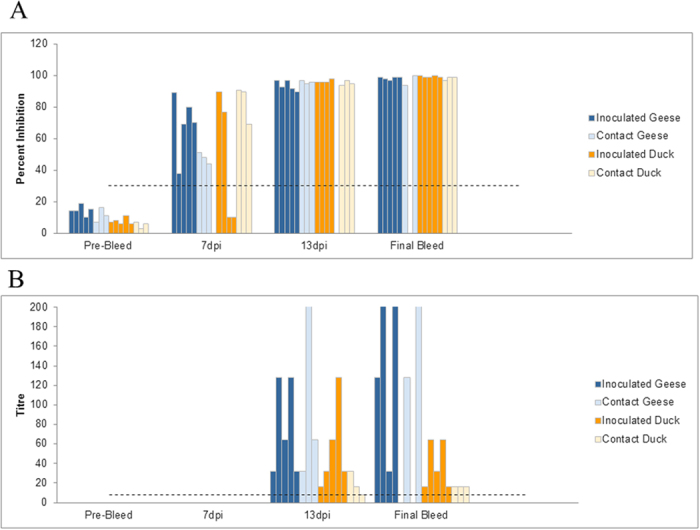
Figure 7. Serologic data for Chinese geese and Muscovy ducks that were infected with FAV-002/H5N1 virus and their corresponding contact groups.

(A) shows influenza A virus nucleoprotein antibodies levels at different intervals of time using cELISA. Values above 30% inhibition (dotted line) were considered positive. No significant differences were found among inoculated versus contact ducks and geese at each time point. Significant differences (P value < 0.001) were however found between final bleed versus pre-bleed, 13 dpi versus pre-bleed, 7 dpi versus pre-bleed, final bleed versus 7 dpi and 13 dpi versus 7 dpi groups based on two-way ANOVA followed by the Holm-Šídák multiple comparison test. (B) illustrates anti-H5 antibody levels based at different intervals of time. Antibody detection is based on the hemagglutination-inhibition test using homologous FAV-002/H5N1 antigen. HI titers above 8 (dotted line) were considered positive. A statistically significant (P = 0.023) interaction was found between animal groups (inoculated/contact geese and inoculated/contact ducks) and time post-inoculation. Statistically significant differences were observed in HI titers of animals between the following time points: final bleed versus pre-bleed (P < 0.001), final bleed versus 7 dpi (P < 0.001), 13 dpi versus pre-bleed (P = 0.027) and 13 dpi versus 7 dpi (P = 0.022). Inoculated geese showed significantly different HI titers at the following time points: final bleed versus pre-bleed (P < 0.001), final bleed versus 7 dpi (P < 0.001) and final bleed versus 13 dpi (P = 0.003). Finally significant differences in HI titers were observed in the contact geese group at the following time points: final bleed versus pre-bleed (P = 0.011) and final bleed versus 7 dpi (P = 0.013). Analysis was by two-way ANOVA followed by the Holm-Šídák multiple comparison test.
