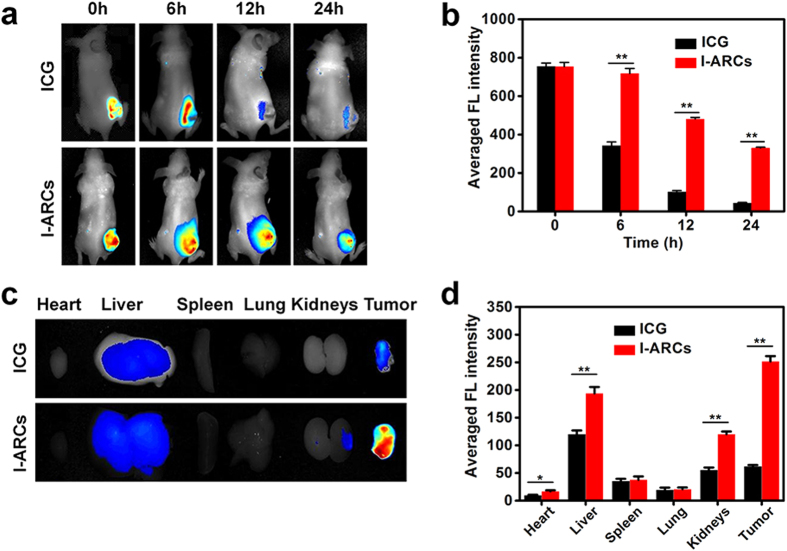
Figure 5. The biodistribution and metabolism of I-ARCs in vivo.
(a) Time-lapse NIR FL images of nude mice after intratumoural administration of free ICG or I-NARCs. (b) Quantified NIR FL intensities around the tumour at indicated time points. *P < 0.05, **P < 0.01. (c) NIR FL images of major organs and tumours after injection of free ICG or I-NARCs at 24 h. (d) Semiquantitative biodistribution of free ICG or I-NARCs in nude mice determined by the averaged FL intensity of organs and tumour. *P < 0.05, **P < 0.01.

