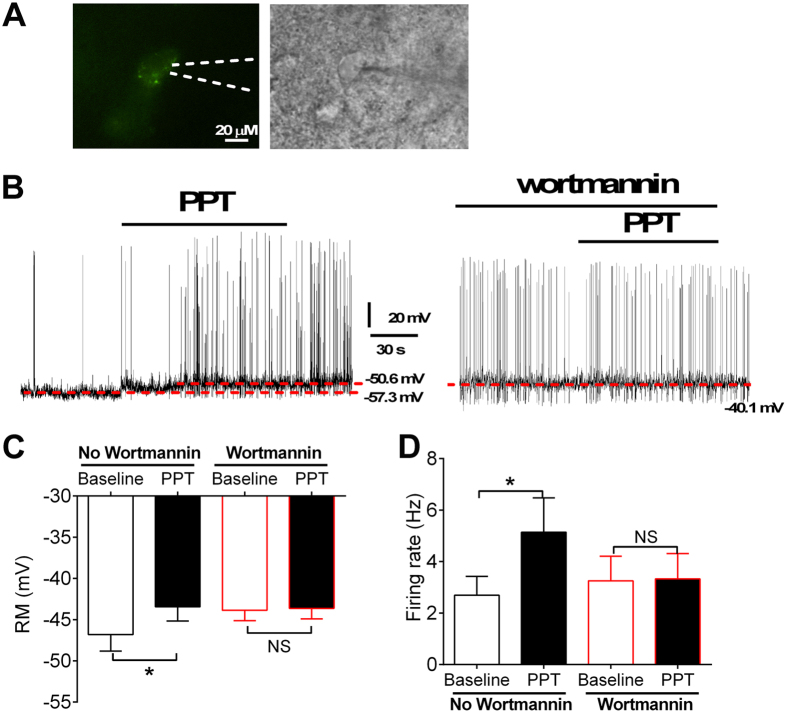
Figure 3. Effects of PPT on cellular activities of VMH ERα neurons.
(A) Recording one ERα neurons in the VMH visualized under green fluorescence (left) and brightfield (right) microscopy. The scale bar = 20 μM. (B) Representative electrophysiological responses to PPT (100 nM bath) in the absence or the presence of wortmannin (10 μM). (C) Summary data for resting membrane potential. (D) Summary data for firing rate. N = 11 or 13/group. Data are presented as mean ± SEM. *P < 0.05 between baseline and PPT treatment in two way ANOVA analyses followed by post hoc Sidak tests.

