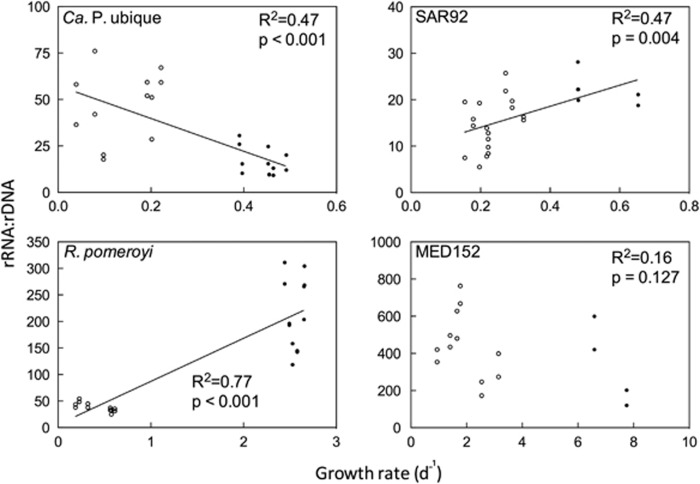
Figure 2.
Ratios of rRNA:rDNA versus growth rate for four bacterial taxa. Lines were calculated from Model II linear regression analyses (P<0.05). The slopes of all three lines are different from one another (Student's t-test, P<0.05). For each sample, two sets of matching technical replicates are plotted. Empty points represent near-stationary phase, while solid points represent exponential growth.

