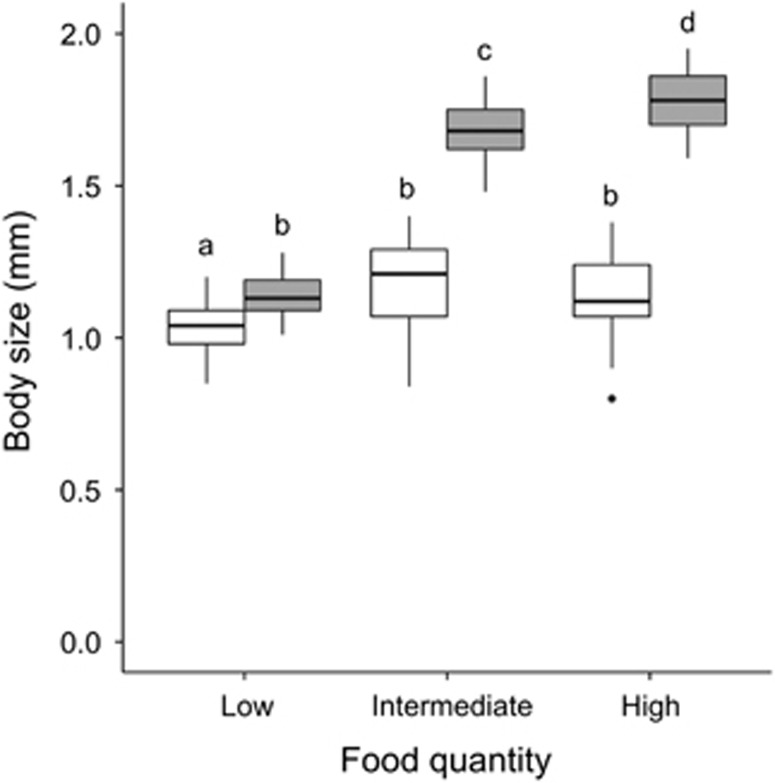
Figure 2.
Boxplot of Daphnia body size exposed to different microbiota- (white=germ-free, gray=symbiotic) and food quantity (low=0.1 mg C l−1 per day, intermediate=0.5 mg C l−1 per day, high=2 mg C l−1 per day) treatments. Letters above samples represent differences as determined by a Tukey HSD post hoc test. Different letters are significant at 5%.

