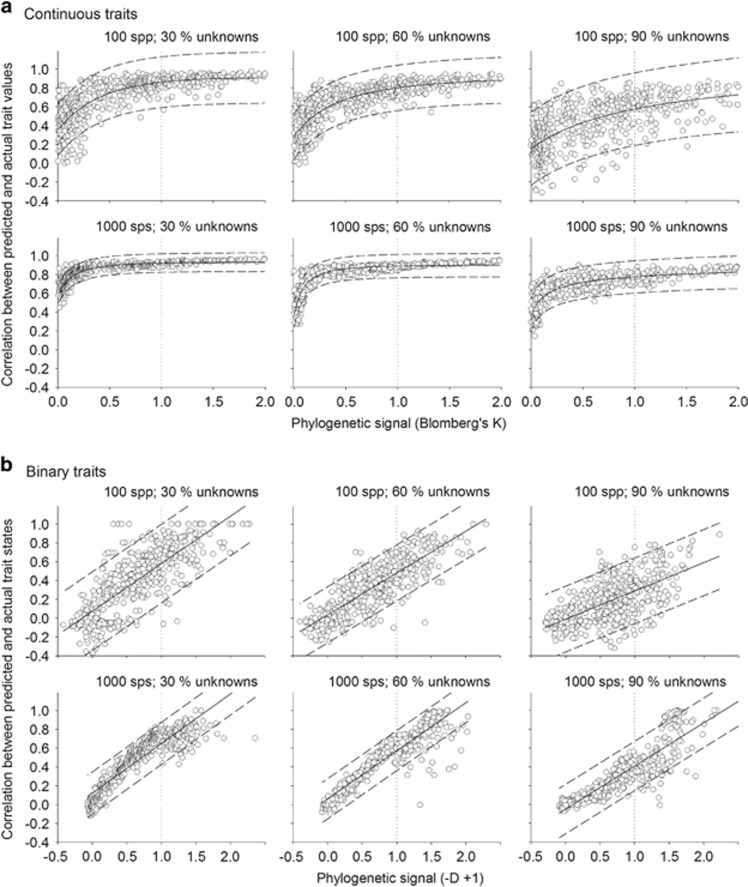
Figure 1.
Accuracy of the PTP method for (a) continuous and (b) binary traits evolved in simulated phylogenetic trees with varying numbers of species in the tree (100, 1000) and proportions of unknown species (30, 60, 90%). The magnitude of the phylogenetic signal increases towards the positive pole of both statistics (K and −D+1). Solid and dashed lines represent the regression slope and prediction intervals. Dotted lines indicate phylogenetic signals equalling a BM expectation.

