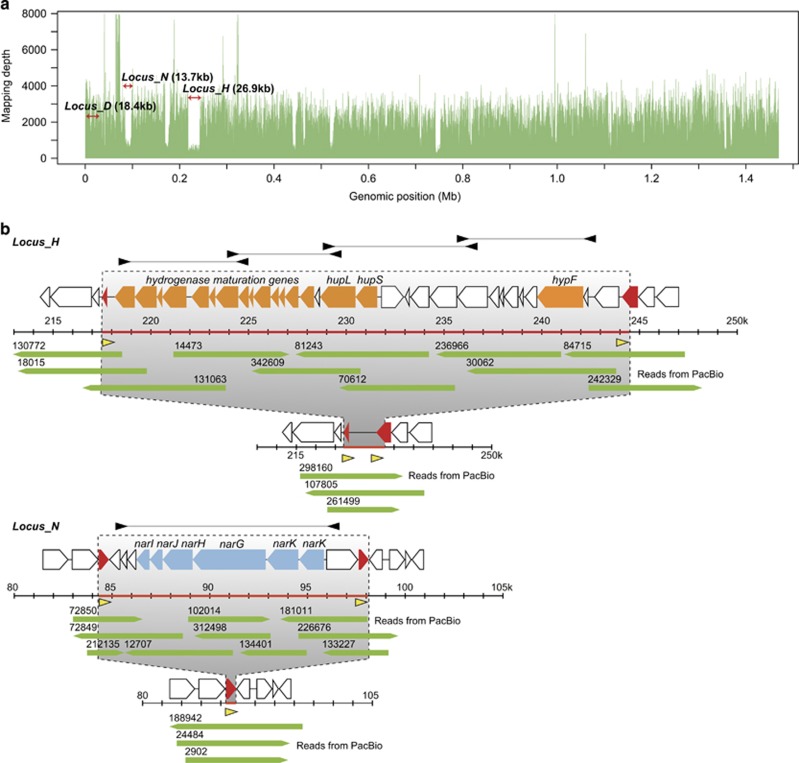
Figure 1.
Loci with low mapping depth including the hup and nar gene clusters. (a) Illumina sequence redundancies mapped on their corresponding genomic positions. The mapping depth of some loci, represented by Locus_H and Locus_N, is lower than that of other genomic regions. (b) Predicted genomic architecture of Locus_H and Locus_N. Cases with or without each gene cluster (hup or nar) are shown. Genes related to the hydrogenase complex and nitrate reductase are indicated with orange and blue arrows, respectively. Duplicated genes (red arrows) are located at both ends of each cluster and form direct repeats (yellow arrowheads). Green arrows indicate PacBio reads. PCR primers used for template preparation of probes for ISH analysis are indicated with black arrowheads.

