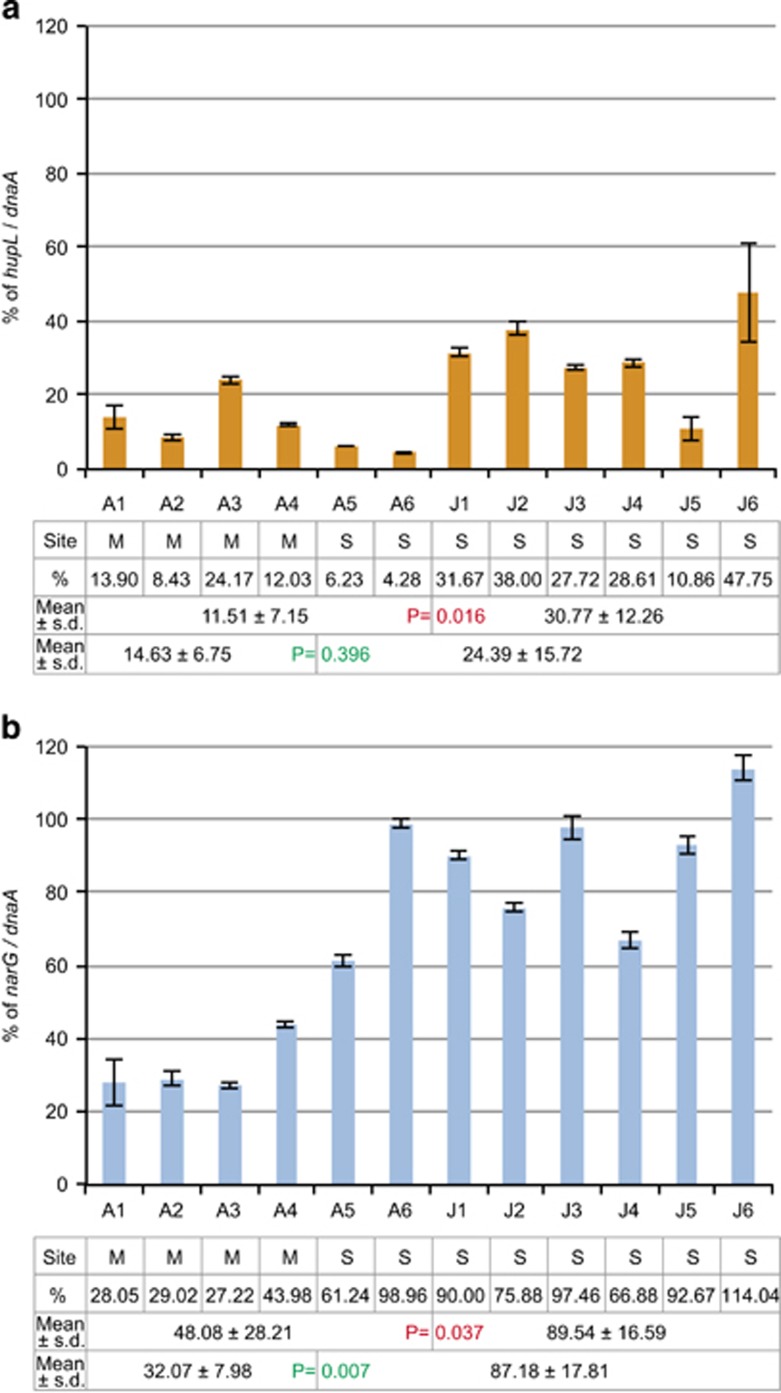
Figure 3.
The proportions of the subpopulation harbouring hupL or narG. (a, b) Proportion (%) of symbiont subpopulations with hupL (a) or narG (b) in each host individual. The amounts of DNA of hupL and narG genes relative to DNA of the reference single-copy gene, dnaA on a locus with average mapping depth, were measured by qPCR in six adult individuals (A1–A6) and six juveniles (J1–J6). Error bars indicate the s.d. for three experimental replicates. The table below the chart indicates the vent sites (M, Myojin Knoll and S, Suiyo Seamount), proportions of hupL or narG to dnaA, mean proportions±s.d. in adults and juveniles, and mean proportions±s.d. in two vent sites. P-values by Mann–Whitney U-test between adults and juveniles, and between Myojin Knoll and Suiyo Seamount are shown in red and green, respectively.

