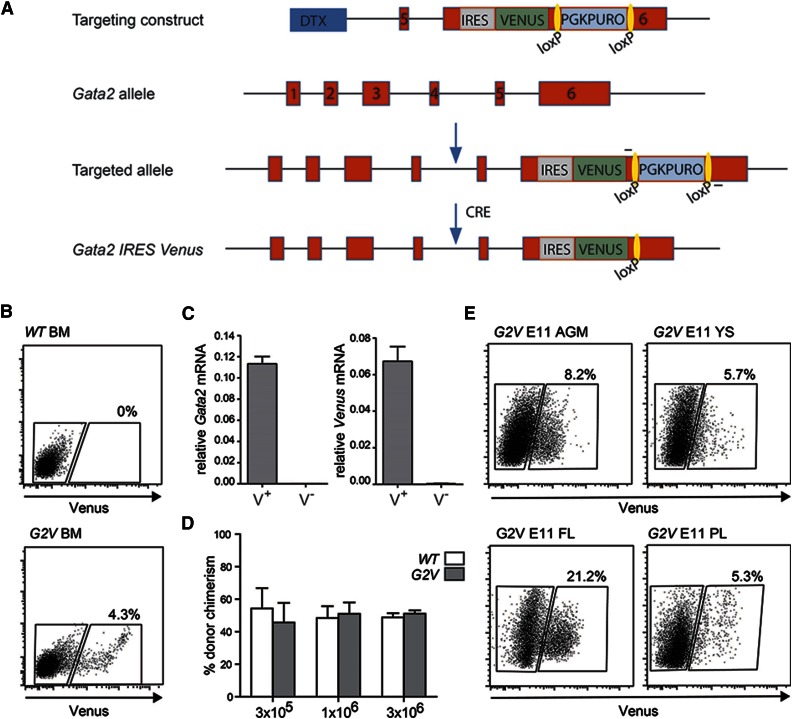
Figure 1.
Gata2 Venus reporter construction and validation. (A) Schematic diagram of the IRES Venus reporter selection cassette insertion in the 3′UTR of the mouse Gata2 locus and Cre-mediated removal of lox PGK-Puro lox. Primers used for detection of the targeted and recombined alleles are indicated flanking the loxP sites (yellow). (B) Representative flow cytometric analysis and sorting plot of Venus-expressing cells in the BM of adult Gata2 Venus (G2V) mice. Gated regions show percentage positive and negative viable cells. (C) Relative levels of Gata2 and Venus mRNA in sorted Venus+ and Venus− Gata2V/+ BM cells as determined by qRT-PCR. Gata2 transcripts in Venus+ cells = 0.11337 ± 0.00681 and Venus− cells = 0.00012 ± 0.00003 (P = .000076). Venus transcripts in Venus+ cells = 0.06722 ± 0.00799 and Venus− cells = 0.00036 ± 0.00010 (P = .00112). Mean ± standard error of the mean (SEM), n = 3. (D) Competitive limiting dilution transplantation strategy used to test the quantity and robustness of Gata2V/V BM HSCs compared with wild type. Percentage of donor cell chimerism in adult irradiated recipients cotransplanted with the same number of wild-type (WT) Ly5.1/5.2 and Gata2 Venus (G2V/V) Ly5.2 BM cells. Varying numbers (1 × 10⁵, 3 × 10⁵, 3 × 10⁶) of BM cells of each genotype were injected, and peripheral blood of recipients was analyzed for donor cell engraftment by FACS at 1 and 4 months after transplantation. n = 2 (5 mice per group). (E) Representative FACS plots demonstrating frequency of Venus expressing cells in E11 AGM, YS, PL, and FL. Gates indicate Venus− and Venus+ cell fractions. Percentages represent the frequency of Venus+ cells within the viable cell fraction (Table 1).

