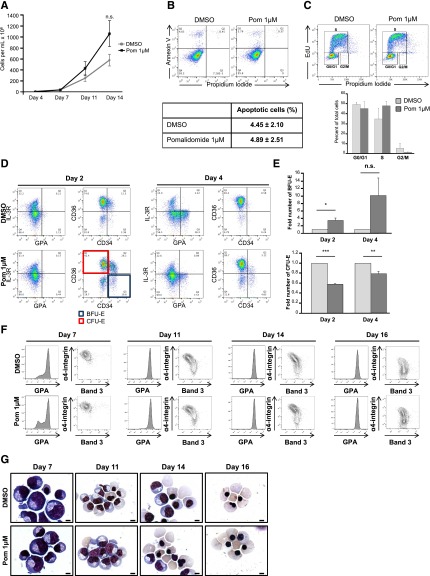
Figure 2.
Pomalidomide delays early erythropoiesis at the BFU-E/CFU-E transition, without altering cell proliferation, viability, and terminal erythroblast differentiation. (A) Growth curves of DMSO and pomalidomide-treated cultures. The data are shown as the mean cells/mL ± SEM (N = 6). (B-C) At day 4 of differentiation, cells were stained with (B) Annexin V and propidium iodide to assess apoptosis (N = 3) or (C) EdU and propidium iodide for cell cycle analyses (N = 3), along with the respective quantifications ± SEM. (D-E) Flow cytometric characterization of erythroid precursors and terminal erythroblast differentiation. (D) Using the surface markers IL-3R, GPA, CD36, and CD34, double-negative (IL-3Rneg/GPAneg) cells were gated and then analyzed for the expression of CD36 and CD34 to identify BFU-E (CD36neg/CD34hi) and CFU-E (CD36hi/CD34neg) populations. (E) Quantification of BFU-E and CFU-E at day 2 (BFU-E *P = .0202; CFU-E ***P = 1.4528 × 10⁻⁵) and day 4 (BFU-E n.s. P = .1272; CFU-E **P = .0088) represented as a fold of DMSO ± SEM (N = 3). (F) Terminal differentiation was monitored via α4-integrin and band3 levels of GPApos cells at indicated days. α4-integrinhi/band3lo cells represent less mature erythroblasts, whereas α4-integrinlo/band3hi cells are further differentiated (N = 6). (G) Representative May-Grunwald Giemsa–stained cytospins showing erythroblast morphology during terminal differentiation in the presence of Pom 1μM or DMSO control (N = 6). The bar represents 5 μm.

