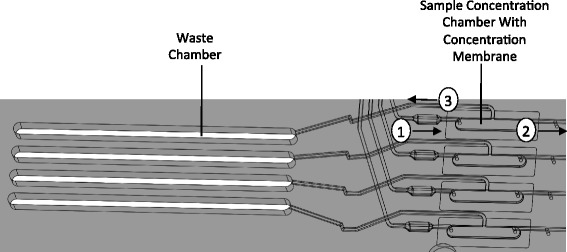
Fig. 2.

Sample concentration module. Schematic diagram of the four concentration channels, one for each independent sample. Purified DNA solution flows into the concentration chamber (arrow 1) from the purification module. Concentrated DNA solution in the retenate flows out of the concentration chamber (arrow 2) to the PCR chamber. Permeate is collected in the waste chamber (arrow 3)
