Fig. 8.

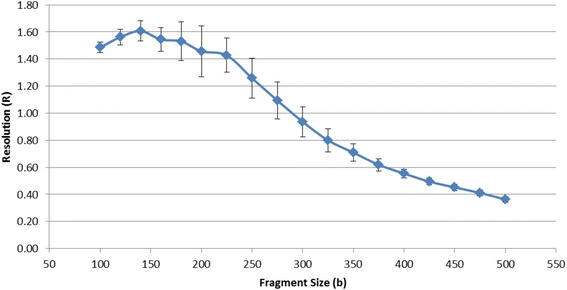
Resolution of the system as determined from 386 samples on 7 instruments. R was calculated as previously described [31]. Error bars represent 1 standard deviation

Resolution of the system as determined from 386 samples on 7 instruments. R was calculated as previously described [31]. Error bars represent 1 standard deviation