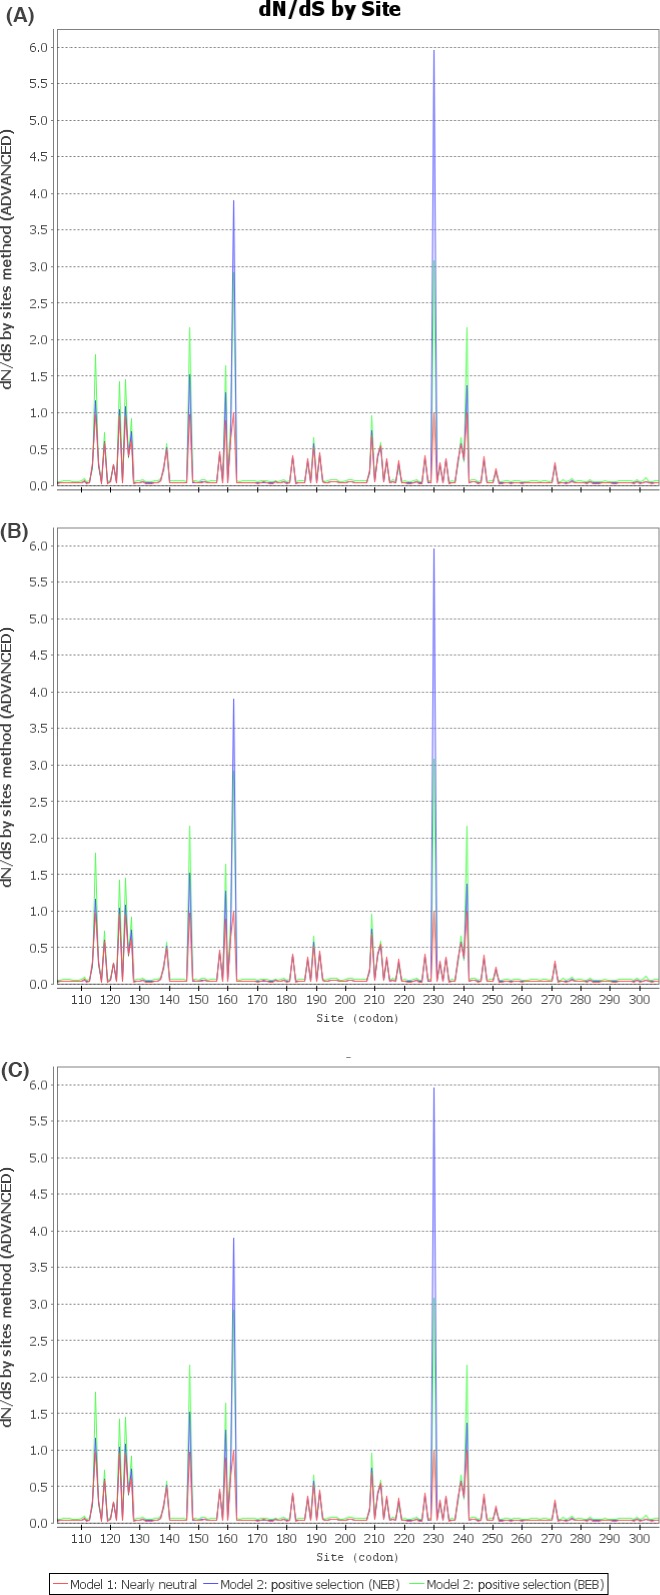
Figure 6.

Graph dN/ dS by site for (A) MBOAT4, (B) MBOAT1, and (C) MBOAT2.) estimated using the NG method. The size of the window was set at 200 bp, with a jump of 25 bp between windows. Codons under positive selection with Empirical Bayes (NEB) model are indicated in blue and in green with Bayes empirical Bayes (BEB) model. Nearly neutral codons are indicated in red.
