Fig. 1.

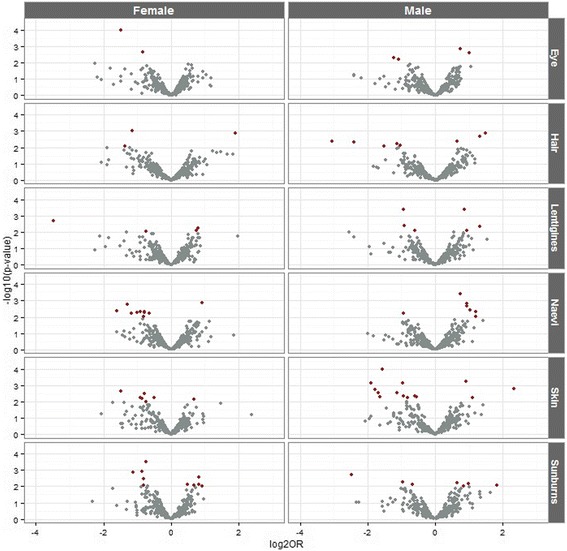
Volcano plots showing significance (−log10 P value) versus fold change (log2 OR) for pigmentation and sun sensitivity traits separated by sex. Red dots indicate SNPs with a significant fold change (P values < 0.01)

Volcano plots showing significance (−log10 P value) versus fold change (log2 OR) for pigmentation and sun sensitivity traits separated by sex. Red dots indicate SNPs with a significant fold change (P values < 0.01)