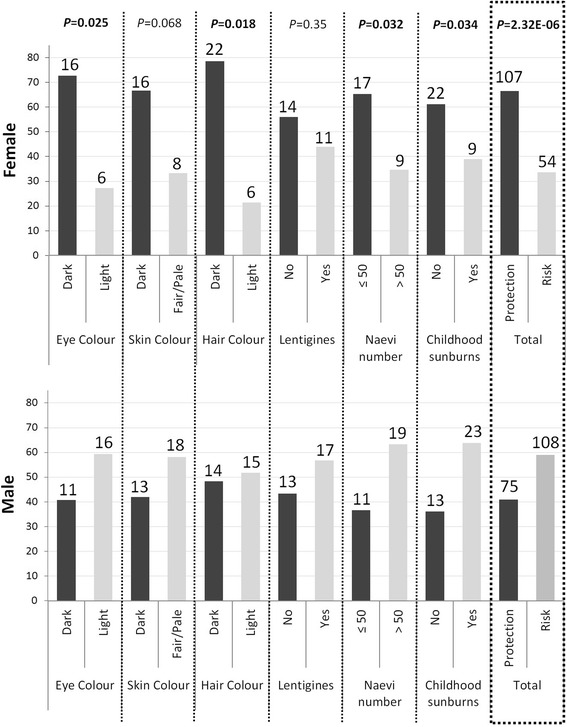
Fig. 2.

Distribution of the SNPs associated with pigmentation and sun sensitivity traits separated by sex. The percentage of each phenotype (protection or risk) is calculated taking into account the total number of significant SNPs associated in males and females (P values < 0.05). Percentages are represented by bars of the corresponding colour. The number on the top of each bar represents the count of associated SNPs in each category
