Fig. 7.

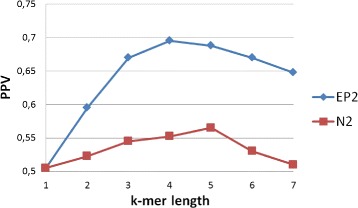
Comparison of mouse tissue-specific enhancers versus versus others tissue-specific enhancers. Values in the graph represents the average PPV, for all tissues, for various k-mer lengths. In this experiment the standard deviation is 0.7

Comparison of mouse tissue-specific enhancers versus versus others tissue-specific enhancers. Values in the graph represents the average PPV, for all tissues, for various k-mer lengths. In this experiment the standard deviation is 0.7