Fig. 3.

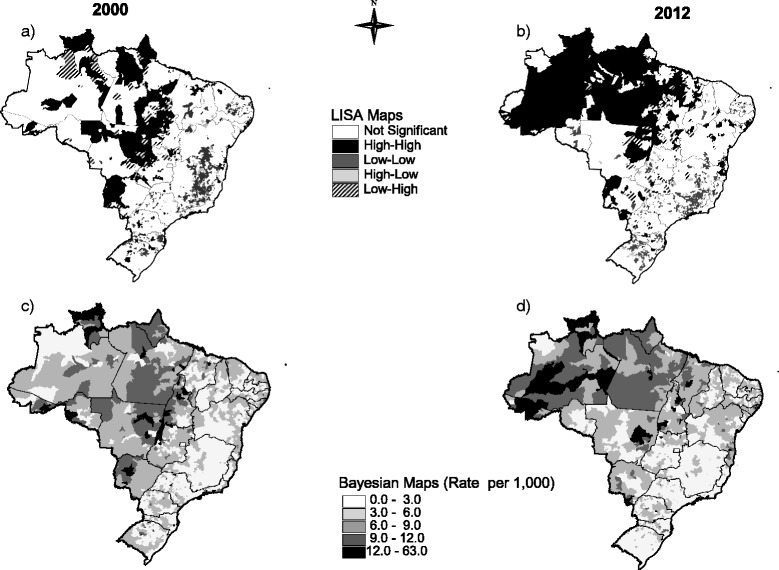
LISA (panels a and b) and Bayesian thematic maps (panels c and d) showing the distribution of fertility rates among adolescents between 10 to 14 years old across Brazilian municipalities, in the years 2000 and 2012

LISA (panels a and b) and Bayesian thematic maps (panels c and d) showing the distribution of fertility rates among adolescents between 10 to 14 years old across Brazilian municipalities, in the years 2000 and 2012