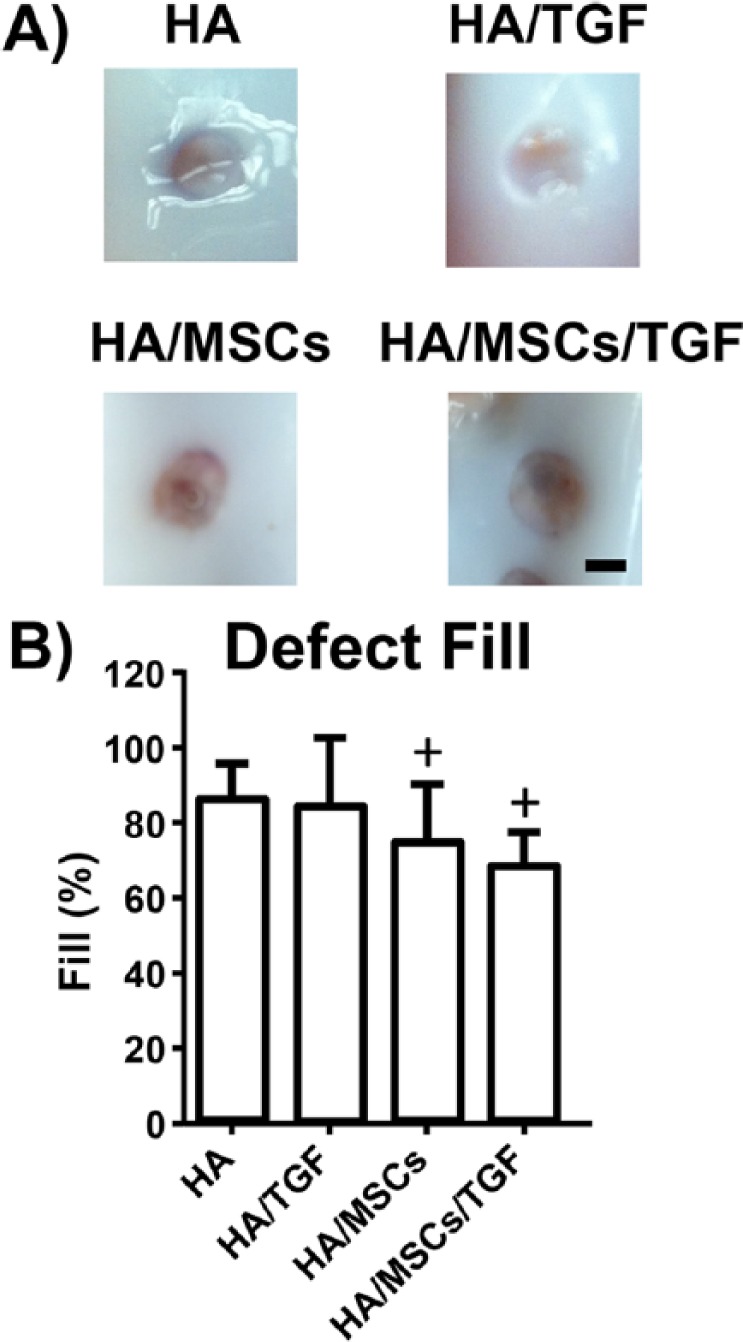
Figure 3.

(A) Gross images of cartilage defects after 6 weeks of healing (scale bar = 2 mm; HA = hyaluronic acid; MSCs = mesenchymal stem cells; TGF = microspheres containing transforming growth factor-β3). (B) Quantification of defect fill via micro-computed tomography reconstruction (+P < 0.05 vs. non-MSC groups).
