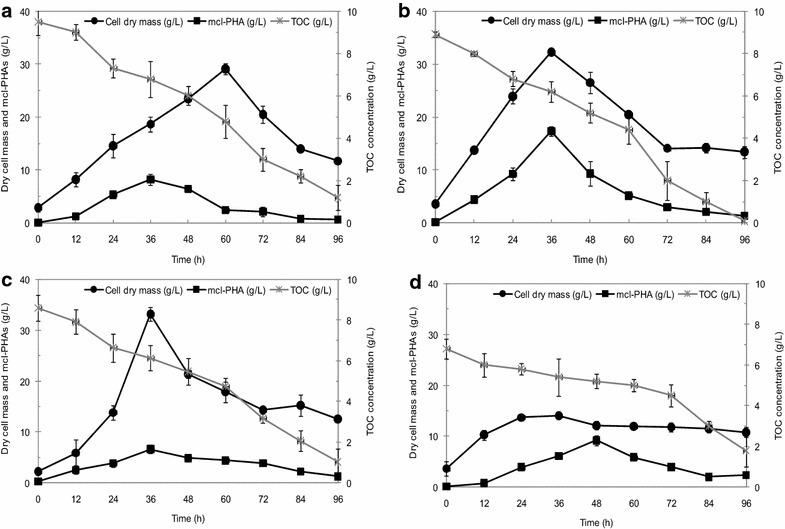
Fig. 3.

Time courses of cell dry mass (g/L), mcl-PHA levels (g/L) and total organic carbon (TOC) concentration (g/L) in cultures. a Acinetobacter sp. ASC1. b Pseudomonas sp. ASC2. c Enterobacter sp. ASC3. d Bacillus sp. ASC4. The cells were grown on crude glycerol with a TOC concentration of 10 g/L and a C/N ratio of 200 in a bioreactor in batch mode. Cultures were performed in triplicate. The error bars represent standard deviations
