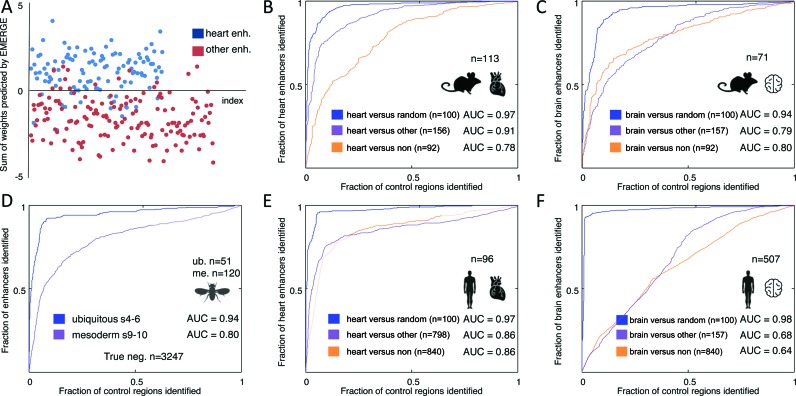
Figure 3.
Benchmarking EMERGE performance with ROC curves. Populations of validated tissue-specific enhancers were split into training and testing data. EMERGE assigns the optimal dataset weights through modelling with an elastic net logistic regression approach on the training data. These weights are subsequently tested on the testing data. (A) Scatterplot of the modelled weights assigned to validated heart enhancers and enhancers active in other tissues, showing clearly separated distributions. This same data served to construct an ROC curve in panel B (purple line). (B–F) Plotted ROC curves of EMERGE enhancer prediction using the training data as indicated and explained in the text. Area under the curve (AUC) values are given for each ROC curve. The number of true positive training regions is indicated above the organ and species icons. The number of true negative (TN) training regions is indicated per category. (B and C) Performance of mouse enhancer prediction by EMERGE on heart (B) and brain (C) tissue. (D) Performance of Drosophila enhancer prediction by EMERGE. Regions tested negative in validation assays were used as TN reference data. (E and F) Performance of human enhancer prediction by EMERGE on heart (E) and brain (F) tissue.

