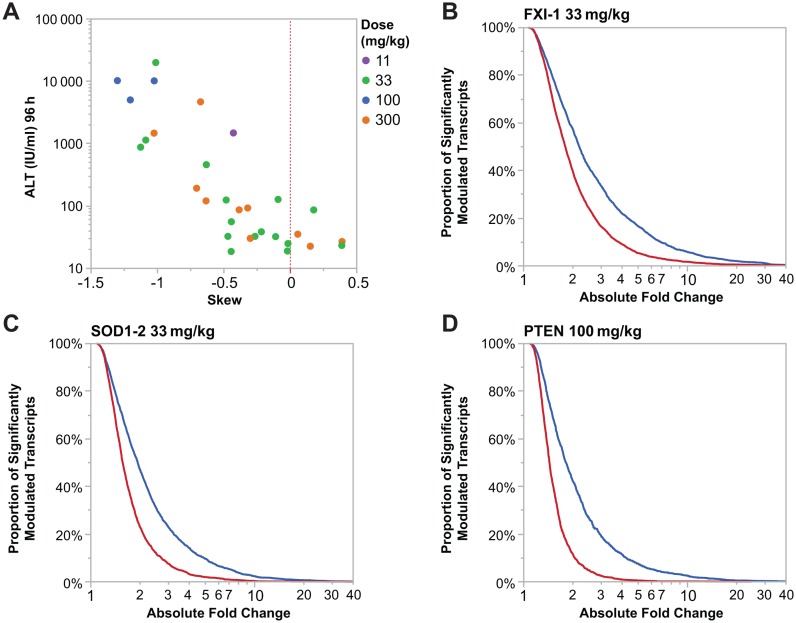
Figure 2.
(A) Increased ALT levels in mice is correlated with an increased number of genes with lowered expression. Skew was calculated using standard methods as implemented in the python scipy package. Each dot represents an LNA ASO at a specific dose represented by the color of the dot. (B–D) Cumulative distribution function plot demonstrating that hepatotoxic LNA ASOs (FXI-1, SOD1–2 and PTEN LNA, respectively) are down-regulating a greater proportion of significantly modulated transcripts (P-value ≤ 0.05) and to a greater intensity (absolute fold change) than significantly up-regulated transcripts (P-value ≤ 0.05).

