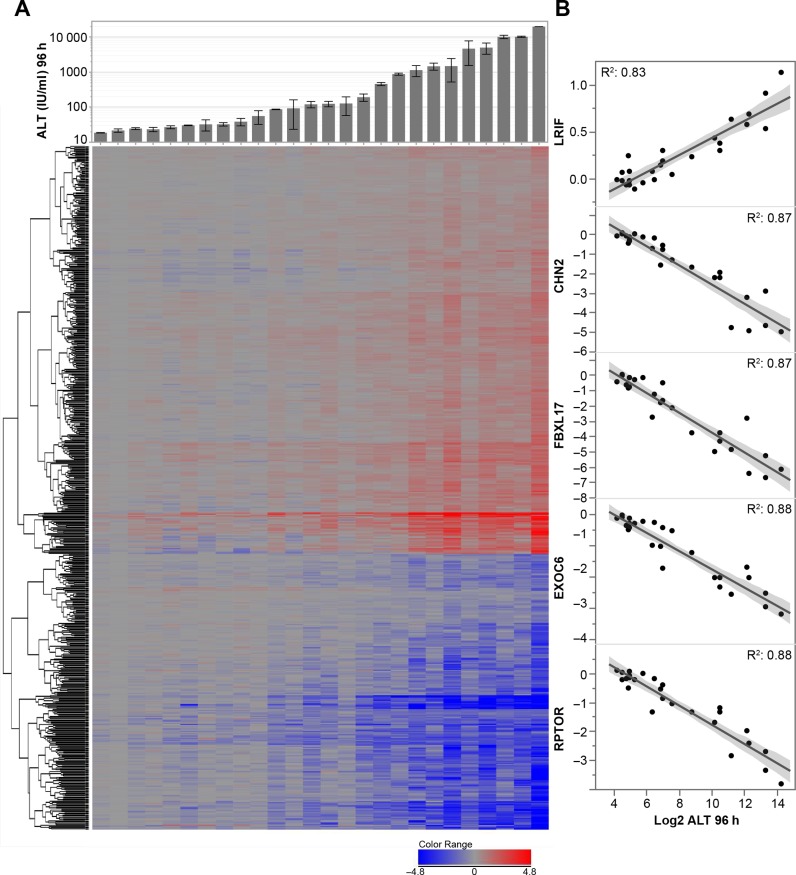
Figure 3.
(A) Upper panel: Mean of plasma ALT (IU/ml) measured 96 h post treatment. Bottom panel: Oneway hierarchical clustering of transcripts significantly modulated in the liver at 24 h post treatment by LNA ASOs in correlation with ALT increase at 96 h. (Prob > 0.000001, r2 > 0.54). Thirteen LNA ASOs were tested at 1 or 2 doses (min 11 mg/kg, max 300 mg/kg as detailed in Table 3). Each column represents the average expression for a given ASO/dose. Up-regulated transcripts are represented in shades of red (n = 353) and down-regulated transcripts in shades of blue (n = 240). (B) Top 5 mRNA transcripts whose modulation 24 h post treatment is the most correlated to ALT increase 96 h post treatmentselected from panel A. Normalized liver mRNA transcripts level 24 h post ASO treatment (y-axis) versus Log2 of serum ALT level 96 h post treatment (x-axis) for the R2 is shown.

