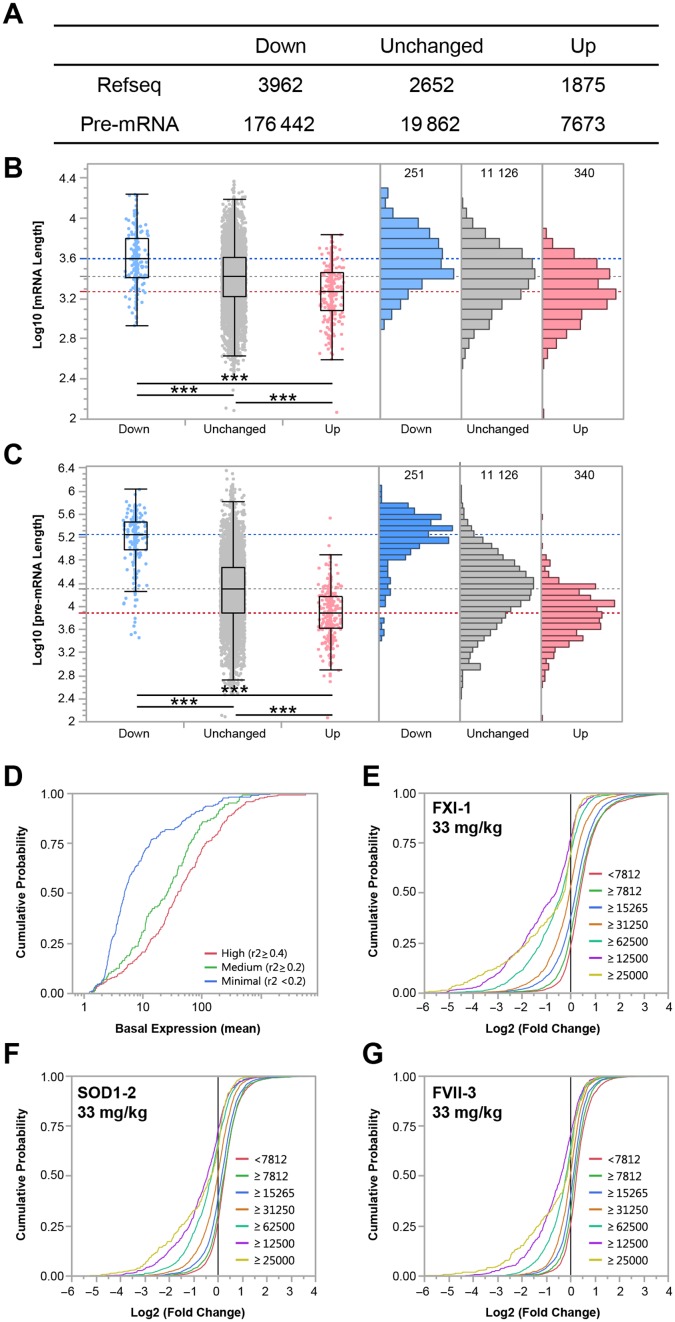
Figure 4.
(A) Median length of mRNA and pre-mRNA transcripts expressed on the microarray as a function of the modulation: ‘Down’ represents the number of transcripts down-regulated 24 h post treatment (240) negatively correlated to ALT increase at 96 h, ‘Up’ represents the number of transcripts up-regulated 24 h post treatment (353) positively correlated to ALT increase at 96 h (Prob > 0.000001, r2 > 0.54). Distribution of mRNA (B) and pre-mRNA (C) transcripts expressed on array. The blue horizontal line represents the median length of down-regulated transcripts, in gray unchanged transcripts and in red, up-regulated transcripts. (D) Cumulative probability plot of the basal expression levels of long (pre-mRNA length > 125 000 b) down-regulated transcripts with high (red), medium (green) or minimal correlation to ALT increase, shows transcripts with low level of basal expression tend to exhibit a low level of correlation with ALT increase following treatment with hepatotoxic ASOs. (E–G) Cumulative probability plot of fold change of modulated transcripts binned by pre-mRNA length for three hepatotoxic LNA ASOs (FXI-1, SOD1–2 and FVII-3 LNA at 33 mg/kg, respectively) treatment group are represented. The proportion of transcripts as well as the intensity of transcript down-regulation increases as a function of the length of pre-mRNA transcripts.

