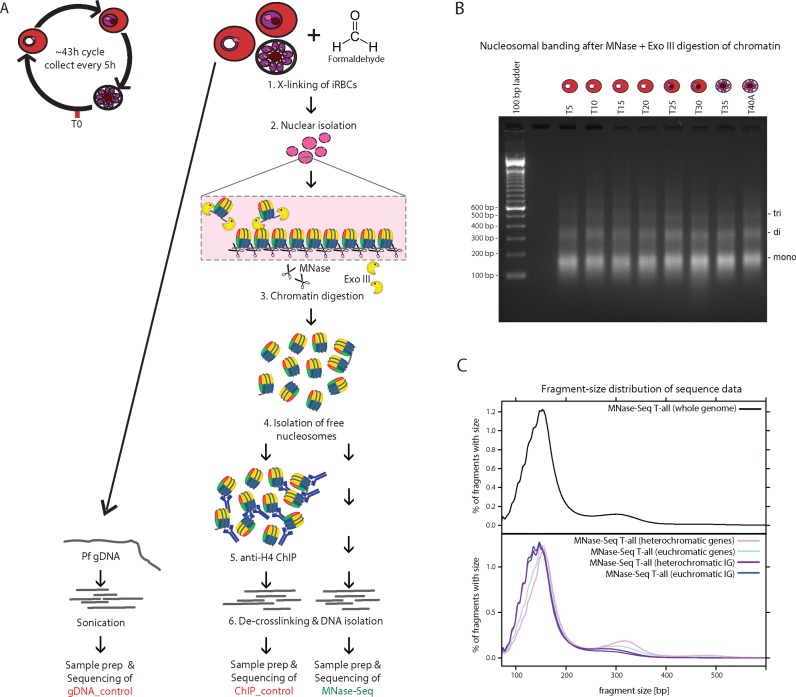
Figure 1.
Highly controlled MNase-seq reveals variable size-distribution of nucleosomal DNA at distinct genomic regions. (A) Schematic of experimental procedure. For details on experimental procedures and controls see Supplementary Results and Discussion. (B) MNase + exonuclease III-digested chromatin separated on 2% agarose gel demonstrating comparable digestion across the stages (5–40 h post invasion, T40A is one of the technical replicates from 40 hpi). (C) Distribution of fragment sizes inferred from the uniquely aligned read pairs in the pooled MNase-seq libraries (T-all, top panel) and from MNase-seq T-all fragments aligning to hetero- (purple) or euchromatic (blue) genic (light) or intergenic (dark) regions (bottom panel), respectively.

