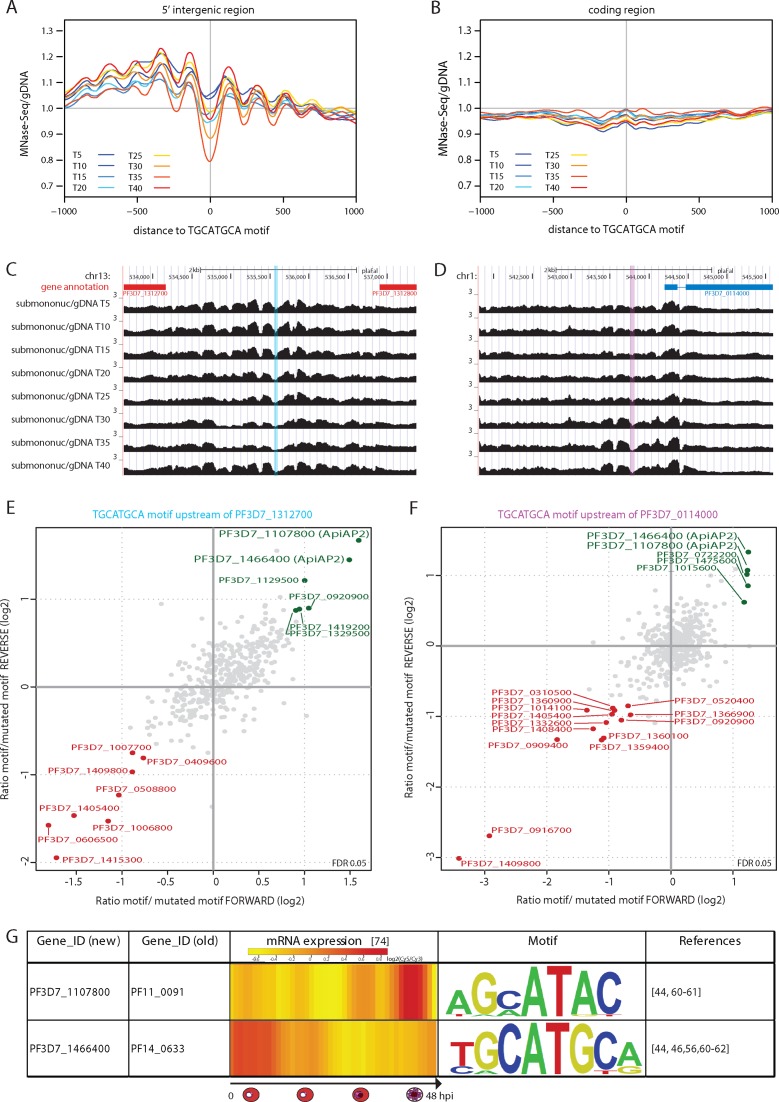
Figure 5.
The nucleosome landscape can be predictive for functional DNA motifs. Smoothened, gDNA-corrected average nucleosome occupancy profiles around the top 394 or 726 scoring occurrences with P-value ≤ 8.43 × 10⁻⁵ of the TGCATGCA motif that are located in (A) upstream or (B) coding regions. (C and D) Screenshot of the nucleosome landscape (MNase-Seq-over-gDNA ratio for sub + mono-nucleosomal fragments) around two TGCATGCA motifs. Motif +/− 25 nt upstream of genes PF3D7_1312700 (C) and PF3D7_0114000 (D) is highlighted (blue and pink) and used for DNA pulldown experiments. Blue gene: forward strand; Red gene: reverse strand. (E and F) Scatterplot displaying the quantitative proteomic analysis of duplicate, label-swap DNA pulldowns performed with 500 μg mixed-stage nuclear extract. Statistically significant outliers (FDR < 5%) displaying preferential binding to TGCATGCA (green) or mutated-motif (red) containing probes upstream of genes PF3D7_1312700 (E) or PF3D7_0114000 (F) are marked. The y-axis of plot (F) is not auto-scaled and excludes a single data-point located at (x,y)-coordinates (−0.48, 5.06). (G) Table displaying steady-state mRNA level heatmaps (log2(Cy5/Cy3)-ratio from (59)) and the consensus-motif recognized by recombinant DNA-binding-domain for PF3D7_1107800 (from (44)) and PF3D7_1466400 (from (56)).

