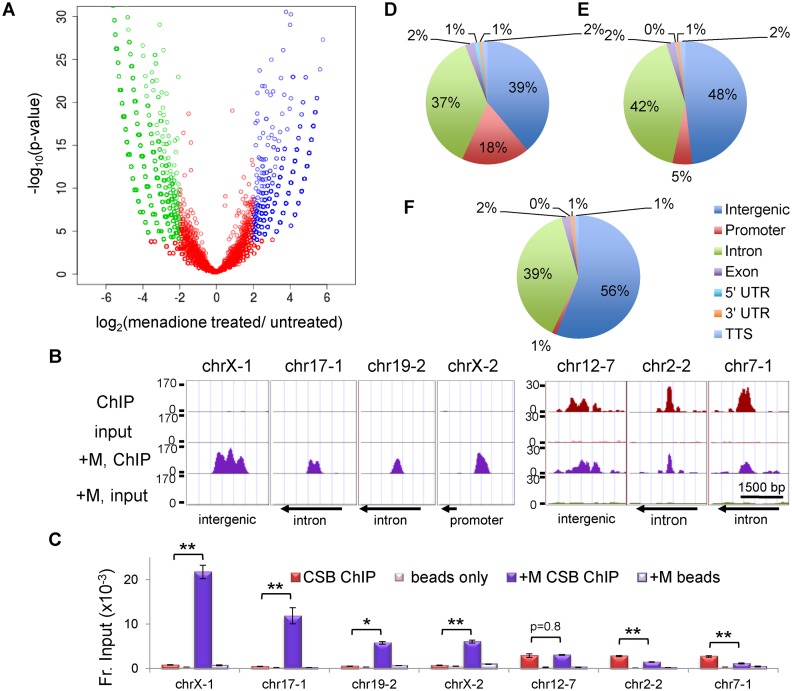
Figure 2.
Comparison of CSB occupancy in cells with or without menadione treatment. (A) A volcano plot showing the correlation between CSB ChIP-seq results from cells with or without a 1-h menadione treatment (100 μM). (B) Screen shots of CSB ChIP-seq results from seven genomic regions, displayed using the UCSC genome browser. The y-axis is number of normalized sequencing reads. The x-axis represents the genomic coordinates; chrX-1, chrX:73766518–73766600; chr17-1, chr17:49770395–49770537; chr19-2, chr19:45793789–45793877; chrX-2, chrX:48568220–48568299, chr12-7, chr12:13679173–13679256; chr2-2, chr2:180325437–180325517; chr7-1, chr7:2001695–2001793. The directions of nearby transcription (arrows) are noted at the bottom. (C) Validation of CSB ChIP-seq results by ChIP-qPCR. Bar graphs showing CSB ChIP-qPCR results with matched beads-only controls. Shown are means ± SEM (n = 3). A paired t-test was used to determine if the difference in CSB enrichment before and after menadione treatment was significant. Single asterisks indicate P values < 0.05, and double asterisks indicate P values < 0.01. (D–F) Genomic distribution of CSB occupancy sites. The genome was divided into seven categories, as defined by the UCSC RefSeq gene annotation. (D) Menadione-induced CSB occupancy. (E) Common CSB occupancy. (F) Menadione-repressed CSB occupancy.

