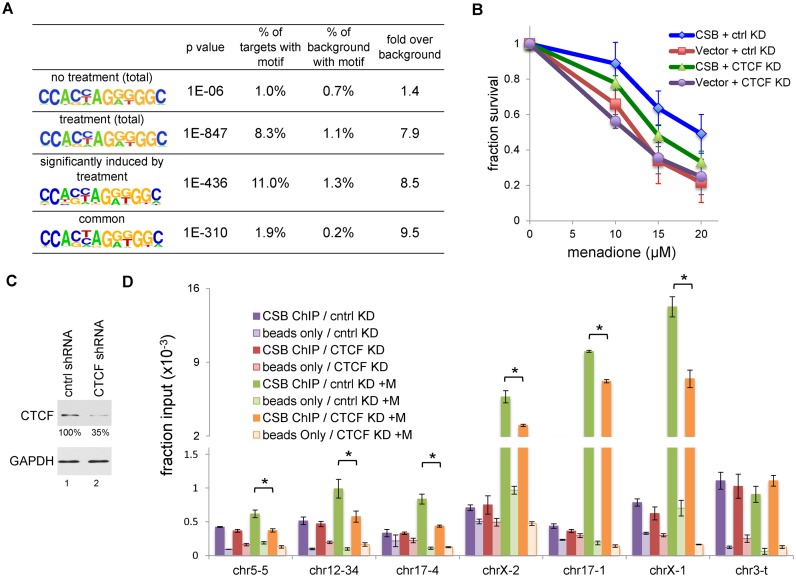
Figure 3.
CTCF collaborates with CSB in response to oxidative stress. (A) Motif analysis of CSB ChIP-seq data. (B) Menadione sensitivity assays on CSB expressing and non-expressing (Vector) cells with decreased CTCF levels. Shown are means ± SEM (n = 4). (C) Western blot showing a reduction in the CTCF protein level in cells expressing CTCF shRNA. Relative CTCF levels are shown below the CTCF blot. (D) CSB ChIP-qPCR assays in cells infected with lentivirus expressing control or CTCF shRNA, with or without with a 1-h menadione treatment (100 μM). Shown are means ± SEM (n = 3). A paired t-test was used to determine if the difference in CSB enrichment with and without CTCF shRNA treatment was significant. Asterisks indicate P-values < 0.05.

