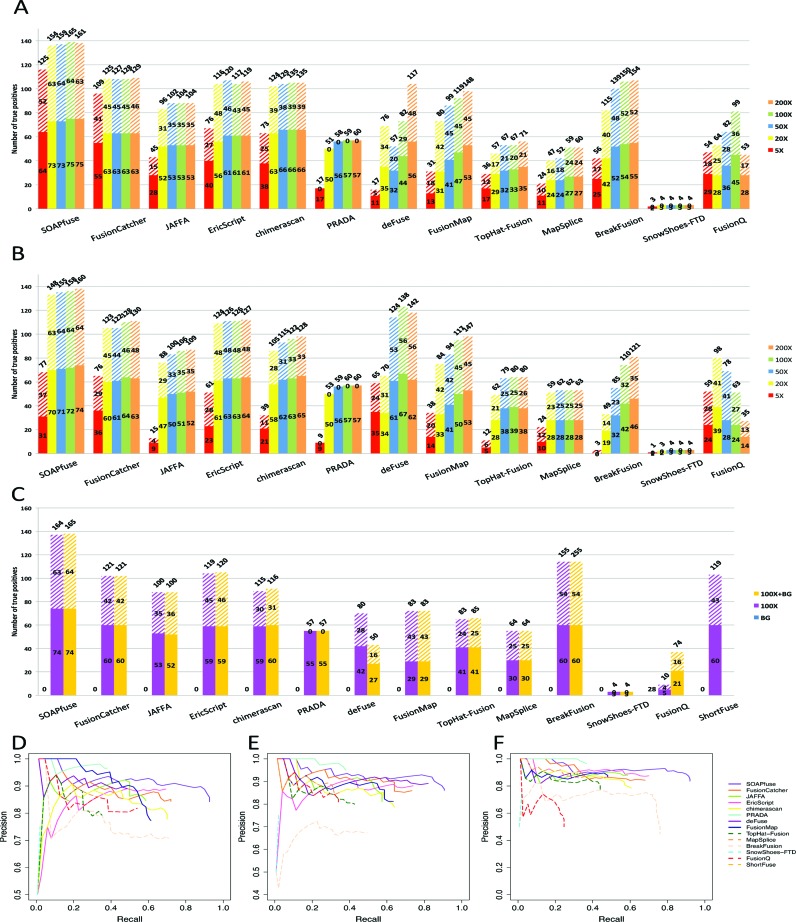
Figure 2.
Fusion transcript detection results for synthetic data sets with 100 bp read lengths. (A–C): The y-axis bars show the number of true detected positives, among them IE-type and BE-type fusions are shown in solid and slashed rectangles. The total number of fusion detections are shown on the top of the bars. (A) Result for type-1A synthetic data (100 bp read length), (B) result for type-1B synthetic data (100 bp read length) and (C) result for type-2, type-3A and type-3B synthetic data (lung sample 50 bp read length). (D) Precision-recall plot for type-1A synthetic data (100 bp read length and 100X). (E) Precision-recall plot for type-1B synthetic data (100 bp read length and 100X). (F) Precision-recall plot for Type-3B synthetic data (lung sample 50 bp read length and 100X).

